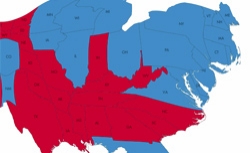
If States Were as Big as Their Vote Counts
A cartogram of votes cast, state by state.
Tuesday delivered President Barack Obama to the White House for a second term, but fewer voters turned out in this presidential election than the last. While 131 million people voted in 2008, about 120 million (and counting) voted in this election, according to preliminary data. The map above shows how the 2012 electoral map would look if states were sized according to the number of votes cast in them.
Mouse over each state to see its turnout rate. The country as a whole saw a 58-percent turnout rate, down 4 percent from the last presidential election, according to the Associated Press. Click and drag the map to see Hawaii and Alaska.
