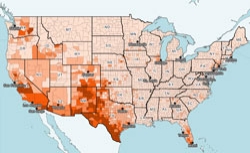
Where Hispanics Live
A map of America’s Hispanic population, county by county.

In the race to the White House, no ethnic group is more prized than Hispanics. President Obama ended deportations for some young undocumented immigrants, and the Romney campaign is vetting Sen. Marco Rubio, R-Fla., who would be the country’s first Hispanic candidate for vice president. It’s no wonder each campaign is trying to woo Hispanics, whose unsettled opinions of Democrats and Republicans make them ripe for the taking. Although Obama won twice as many Hispanic votes in 2008 than John McCain, only four years earlier George W. Bush claimed 40 percent of the Hispanic vote, a modern high for a Republican candidate. Support from Hispanics in battleground states such as Florida or Colorado could swing the election to a candidate's favor. Most Hispanics live in the Southwest and constitute majorities in several counties in Arizona, California, Colorado, New Mexico, and Texas. Chicago, Miami, and the Northeast are also home to large Hispanic populations.
The New America Foundation will host an event at 12 p.m. on Monday to discuss the impact Hispanic voters will have in the 2012 election. Manuel Roig-Franzia, author of The Rise of Marco Rubio, will be on hand to discuss the Rubio factor in this year's election. Tamar Jacoby, president of ImmigrationWorks USA, will also moderate a panel on immigration reform.