It’s no surprise to regular readers I am quite concerned about climate change. My concern on this issue is two-fold: one consists of the actual global consequences of the reality of global warming, and the other is the blatant manipulation of that reality by those who would deny it.
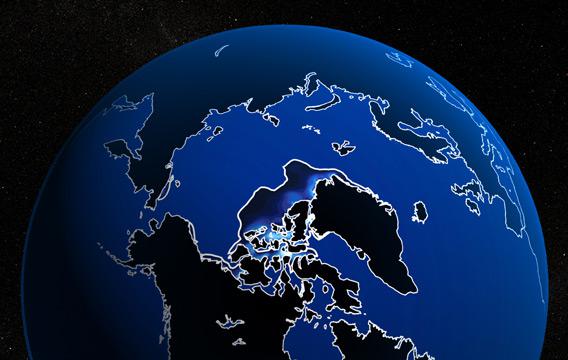
These two issues overlap mightily when it comes to Arctic sea ice. The ice around the North Pole is going away, and it’s doing so with alarming rapidity. I don’t mean the yearly cycle of melt in the summer and freeze in the winter, though that plays into this; I mean the long-term trend of declining amounts of ice. There are two ways to categorize the amount of ice: by measuring the extent (essentially the area of the ocean covered by ice, though in detail it’s a little more complicated) or using volume, which includes the thickness of the ice. Either way, though, the ice is dwindling away. That is a fact.
Of course, facts are malleable things when it comes to the deniosphere. One popular denier claim is that Arctic sea ice extent is higher in recent years than it was in 1989, therefore claims of it melting away are false.
This is so blatantly wrong that it’s hard to believe anyone could make that claim with a straight face. But make it they do, like Lawrence Soloman did in (surprise!) an OpEd in the Financial Post (which, like the Wall Street Journal, is a refuge for denialist claims). Soloman’s silliness is taken apart easily by Tamino on his blog. Harrison Schmitt has made this claim as well. It’s simple cherry picking your data, and a huge no-no when it comes to real science.
When you look at the average, the trend in the ice, it goes down, down, down. Over time, there’s less.
How much less? I was curious about this recently, because most of the graphs I see deal with what scientists call “anomalies”, that is, departures from average. If people average 180 centimeters tall, and you are 182 cm in height, your “height anomaly” is +2 cm. If you were 173 cm tall your height anomaly is -7 cm. Simple, and useful when dealing with some physical effects, but sometimes the emotional impact is lost. If you hear someone has a height anomaly of +15 cm you’d think that was interesting, but if you met them in person you’d see that means they’re really tall.
The same with sea ice. Graphs show us that sea ice is declining over time, but it’s shown as a percentage, or a deviation from some past period. That’s good to give you a grasp of the situation, but doesn’t tell you how much actual ice is left.
So what’s the real loss of ice we’re experience every year?
The answer is: a lot. A whole lot. Even after seeing the numbers, I was taken aback by this graph which shows sea ice extent plotted over time.
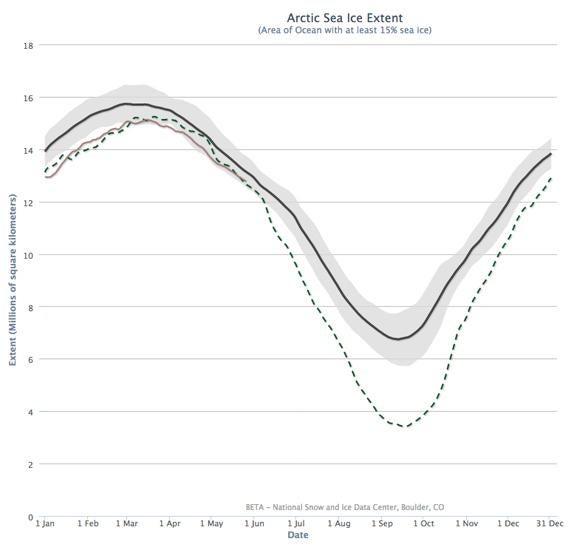
Graph by the NSIDC
The solid black line is the amount of sea ice over the year averaged from 1979 – 2000. The dashed line is the amount in 2012, and the brownish solid line is this year, up to late May. As you can see, we’re right on track to match last year—which was way below average. This plot is from the National Snow and Ice Data Center, and they have an interactive version where you can add or subtract various years. You can see we are headed for serious trouble, and soon. The ten lowest maxima for extent in the satellite record all occurred in the last ten years.
Obviously, Arctic ice grows every winter and melts every summer. In March 2013, the Arctic ice reached its maximum extent, which was the sixth lowest on record (it naturally fluctuates a bit year to year, but the trend is definitely downward). It drops to its minimum extent in September, but on top of that, over time, the minimum amount itself is shrinking.
Look again at the graph, at the bottom of the y-axis. That line is 0, meaning zero ice, essentially nothing but liquid water at the Earth’s north polar regions; that means this graph gives you an absolute scale. Then note that the past year’s minimum was only half the amount of ice we had on average from 1979 – 2000. If you click on previous years to add them to the graph, you’ll see that the past ten years or so have had very low ice minima; these correspond to most of the warmest years on record.
And it gets yet worse. If you look at the volume of sea ice, that drops even faster than the extent. This terrifying video uses a clever graphic to demonstrate just how much sea ice we lose every year.
So the volume of ice is decreasing even faster every year as well; the ice is getting thinner and thinner. This is a very bad sign, as thinner ice melts more easily. No one knows when we’ll have the first ice-free Arctic summer—extrapolating into the future can be difficult—but one thing we can bet on is that it’ll be a lot sooner than the year 2100 as originally predicted just a few years ago. It could be in as little as 30 years. Although some deniers claim this Arctic loss is offset by growth in Antarctic ice, this claim as usual, is simply false.
Of course, oil companies are already planning on exploiting an ice-free Arctic to drill for more oil. The irony is obvious, but there’s also the added point that while oil money is behind a lot of the denial, they themselves are ready to jump on the positive—for them—effects of global warming.
And, no doubt, the deniers will make lots of noise about this, calling me an alarmist and pointing to ever more cherry-picked data and misleadingly plotted numbers. But the fact is the Earth is warming up. That’s melting the ice at both poles, increasing sea levels. We’re still dumping gigatons of carbon dioxide in the air every year, and the amount increases at a steady and measurable level. That CO2 is warming us up.
Stopping the deniers may be as hard as stopping the warming itself. Perhaps once we have satellite images of an ice-free north pole we’ll see a change in public sentiment. It’s a shame that may be what it’ll take. My concern is that by the time that happens, it’ll be too late.