On May 9, 2013, atmospheric levels of carbon dioxide hit a new record high. Announced by the National Oceanic and Atmospheric Administration, the levels of CO2 in the air on that day* reached a daily average of 400 parts per million (ppm). This is the highest level of atmospheric CO2 in human history, and in fact the highest level for at least 800,000 years. It gets worse: the amount of CO2 in the air likely hasn’t been this high since the Pliocene Epoch, more than three million years ago.
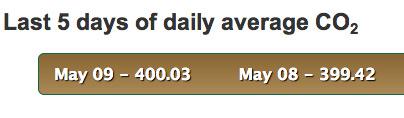
Photo by NOAA
Welcome to the new age of climate change. It’s here, and it’s here to stay.
The measurements were made by the Scripps Oceanographic Institute using a device located at the Mauna Loa observatory in Hawaii. They are the longest-running measurements of their kind anywhere in the world, with continuous readings since 1958, started by Dr. Charles Keeling—hence the term Keeling Curve for the plot. While it’s measured in Hawaii, it’s proven to be a pretty good indicator of worldwide levels.
The device measures the amount of carbon dioxide in dry air, and expresses the result as number of molecules per million, usually called parts per million. So for every million molecules of air measured (mostly nitrogen and oxygen), 400 of those molecules are CO2.
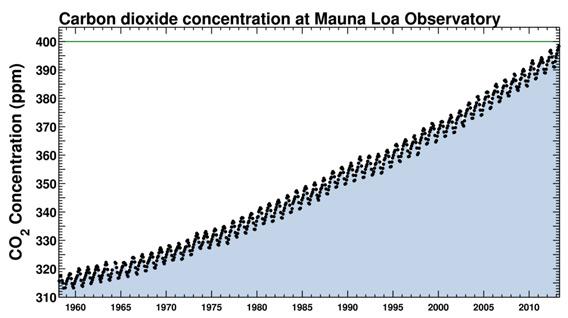
Photo by Scripps Institute/UCSD
It doesn’t sound like much, does it? Yet the affect is profound. Carbon dioxide is a greenhouse gas; it is transparent to visible light, but opaque to far infrared. So sunlight passes through it easily, hitting the Earth’s surface. The ground then warms up and emits infrared light. However, that light cannot get out; it is absorbed by the CO2. This retains the heat, warming the Earth up. That’s why CO2 is monitored so carefully; it has a direct link to global warming.
There are other greenhouse gases as well, like water vapor and methane, but those have a steady effect on the Earth, relatively unchanging over time. CO2, on the other hand, has been increasing as we burn fossil fuels, adding to its effect over time. This is why we are so concerned about it.
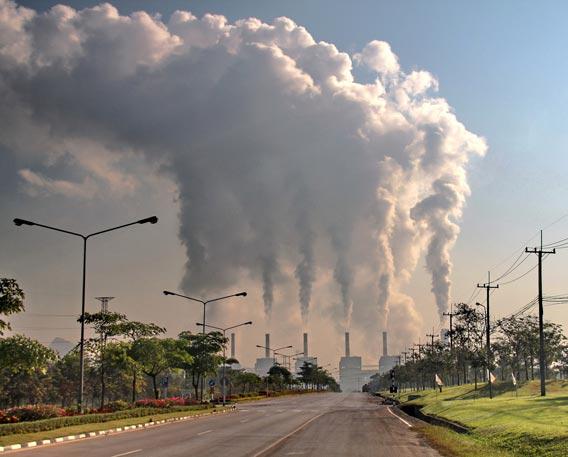
Photo by Ungnoi Lookjeab/Shutterstock
To know the CO2 levels before the 1958 measurements began, other types of methods are used. For example, ice cores taken in various locations around the world (Greenland and Antarctica, for example) are excellent proxies; gas bubbles containing CO2 trapped in ancient ice can be measured, and the age can be determined very accurately (by counting the seasonal ice layers, or measuring the isotope levels of oxygen). That’s how we know that this new level of 400 ppm is unprecedented for nearly a million years. Similar techniques show that the last time levels were this high was several million years ago, in the Pliocene.
The exact level of CO2 fluctuates all the time, even hour by hour. The 400 ppm level has been breached several times on the hourly basis over the past few days, but May 9, 2013 was the first time a daily average exceeded 400 ppm. It will certainly drop below that again; the annual cycle goes up and down by roughly 8-10 ppm, and peaks in May. So it’ll bounce above and below 400 for the net few weeks, but for the next few months will probably start heading back down again to its minimum in October (which will likely be about 394 ppm). But then it will inexorably rise again, and by next May will be even farther above 400.
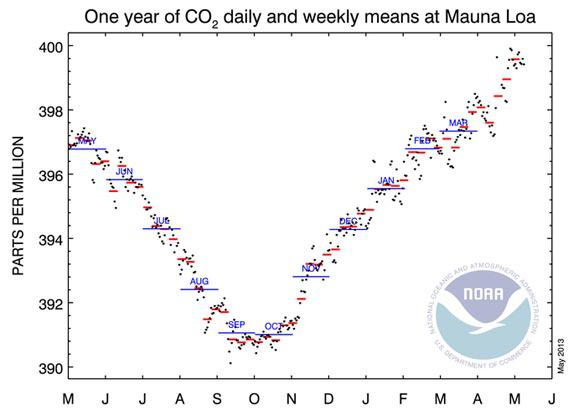
Graph by NOAA
Let me be clear: 400 ppm is a rather arbitrary number. It doesn’t mean temperatures will suddenly soar, or anything like that. But we humans love our milestones, especially when they are round numbers—a fact understood, no doubt, by the Wall Street Journal and the authors of the execrable OpEd I eviscerated this yesterday.
It may be arbitrary, but it is still a stark reminder of many things, none of them good:
- CO2 levels are rising, and they’re rising far faster than any time in human history (and at least for the past 11,000 years).
- CO2 is for real and for sure tied to rising heat content of the Earth. For quite some time that heat has been going into the air, and we’ve seen rising temperatures around the world. At the moment, a lot of that heat is going into warming the oceans, but climatologists expect to see air temperatures increasing rapidly again soon.
- This has direct impacts, like increased temperatures in the air and water, melting ice, and more severe weather. It also has indirect impacts, like fluctuating weather patterns. This makes it difficult to tag any freak storm to climate change, but it does mean that over time, we’ll see more and more. Worse droughts and floods, more forest fires, increased ocean acidification, and more are all expected due to increased carbon dioxide in the air.
- All this is happening on a timescale hugely accelerated over natural cycles. The Earth tends to changes over millions of years; we’re doing this to it in just a century. Without time to adapt, this will have a profound impact on life around the globe.
The simple truth is this: More carbon dioxide is in the air than there has been for millions of years. The world is warming up, and it’s due to human influence. If we do nothing it’ll continue to rise, and even if we get our act together it’ll get worse before it gets better.
* The NOAA is reporting the May 9 level as 400.03, while the Scripps site reports it as 399.73. Part of that is due to simple time-of-day cutoffs, but since the 400 level is somewhat arbitrary anyway, it’s a quibble.