Last month, I wrote about the fun and the pitfalls of viral maps, a feature that included 88 super-simple maps of my own creation. As a follow-up, I’m writing up short items on some of those maps, walking through how I created them and how they succumb to (and hopefully overcome) the shortfalls of viral cartography.
One of the most interesting data sets for aspiring mapmakers is the Census Bureau’s American Community Survey. Among other things, that survey includes a detailed look at the languages spoken in American homes. All the maps below are based on the responses to this survey. However, an ACS participant does not select his language from a list of predeteremined options; he fills in a blank box with his self-selected answer. For instance, some people answered the ACS with “Chinese,” while others gave specific dialects such as “Mandarin” or “Cantonese”. These were all treated as different languages in the ACS data and when constructing these maps. (See the raw data here.) New York is marked “Chinese” because more people responded with “Chinese” than any other language other than English or Spanish. If all Chinese languages (or languages under the umbrella of a larger language family) had been grouped together, the answers for many states would change. In addition, Hawaiian is listed as a Pacific Island language, so following the ACS classifications, it was not included in the Native American languages map. The spelling of each language is based on the language of the ACS.*
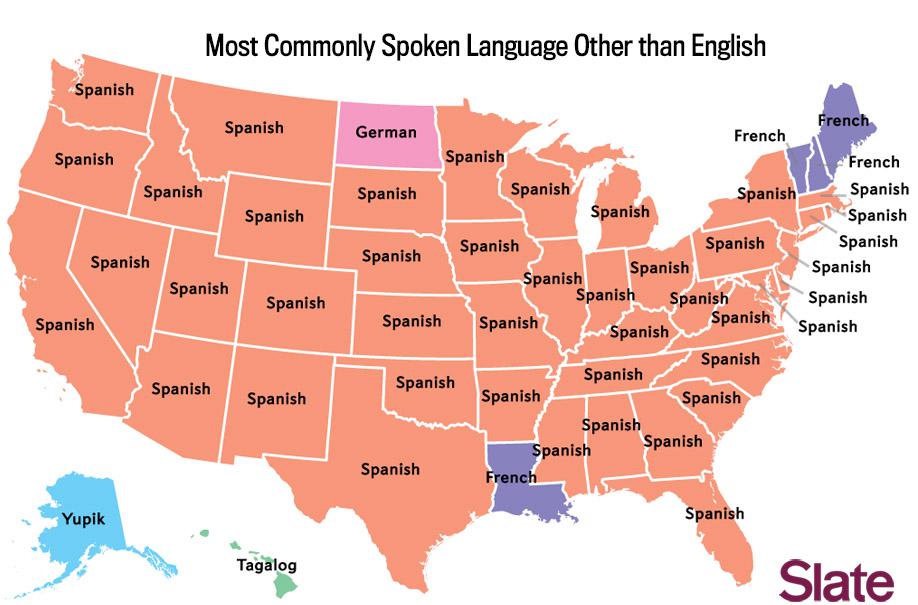
Data source: Census Bureau American Community Survey. Map by Ben Blatt/Slate.
OK, that map is not too interesting. Now, let’s remove Spanish from the mix.
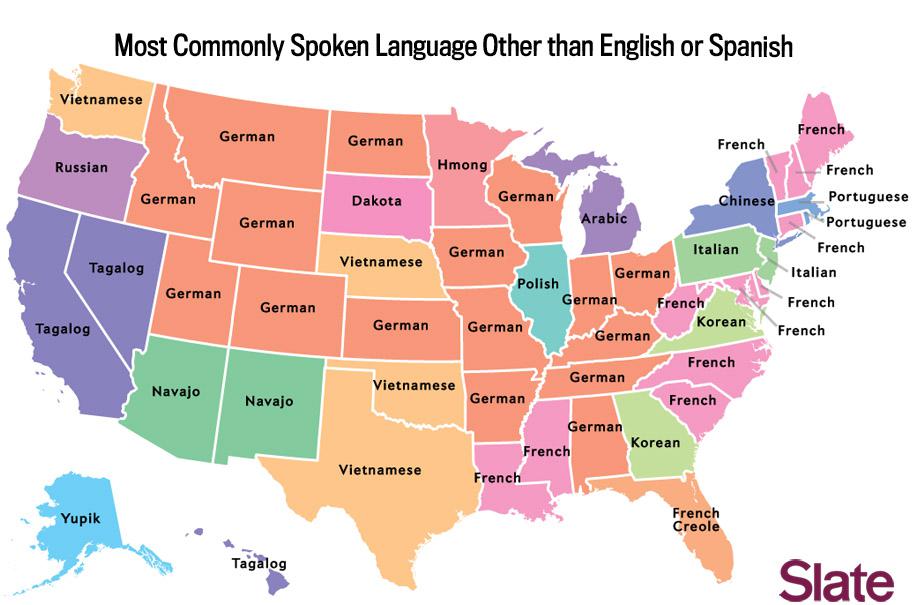
Data source: Census Bureau American Community Survey. Map by Ben Blatt/Slate.
Given these new parameters, we now see a trio of Native American languages, Navajo, Dakota, and Yupik, on the map. Navajo is the most prevalent Native American language, with more than 170,000 speakers, while Dakota lags behind with just 18,000. According to the census, there are more speakers of Navajo in Utah, Colorado, New Mexico, and Arizona than there are speakers of other Native American languages in all other states combined.*
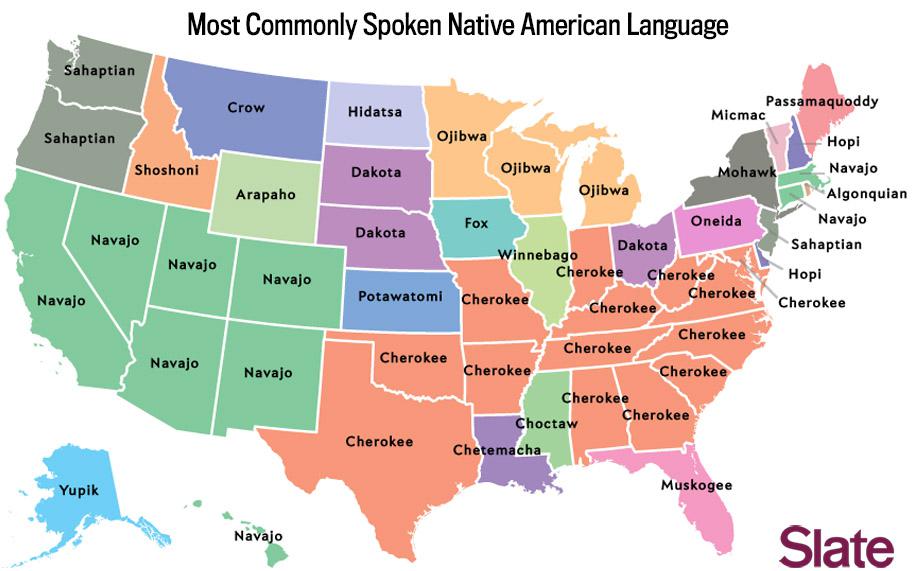
Data source: Census Bureau American Community Survey. Map by Ben Blatt/Slate.
Here are a couple more language groups of interest. First, the Scandinavians. The census categorizes Swedish, Danish, and Norwegian as Scandinavian languages.
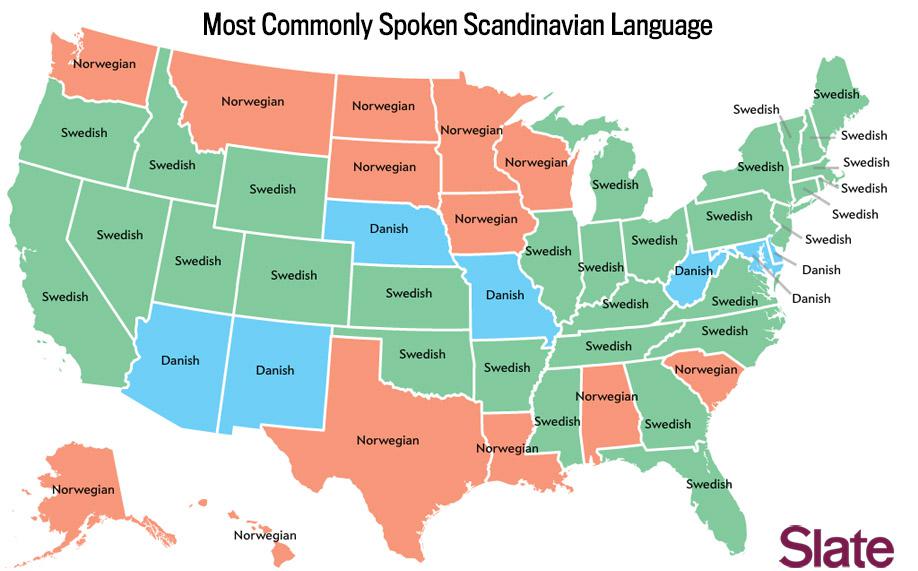
Data source: Census Bureau American Community Survey. Map by Ben Blatt/Slate.
Next up, Indo-Aryan languages. For the purposes of this map, we consider Hindi, Gujarati, Urdu, Bengali, Panjabi, Marathi, Nepali, and Sinhalese to fall into that category.
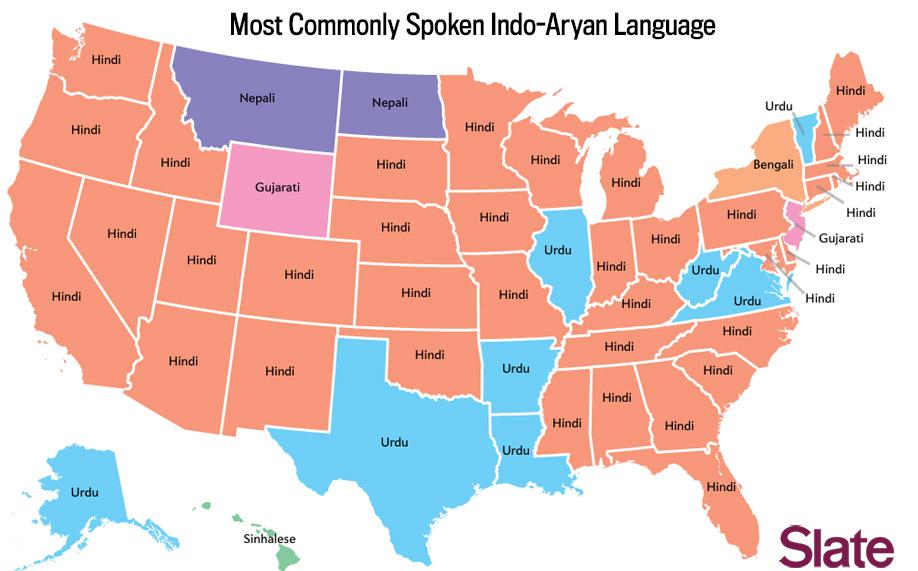
Data source: Census Bureau American Community Survey. Map by Ben Blatt/Slate.
Finally, African languages. The choices here are Amharic, Berber, Chadic, Cushite, Sudanic, Nilotic, Nilo-hamitic, Nubian, Saharan, Khoisan, Swahili, Bantu, Mande, Fulani, Gur, Efik, Mbum, as well as “Kru, Ibo, Yoruba,” which the census lists as a single language.
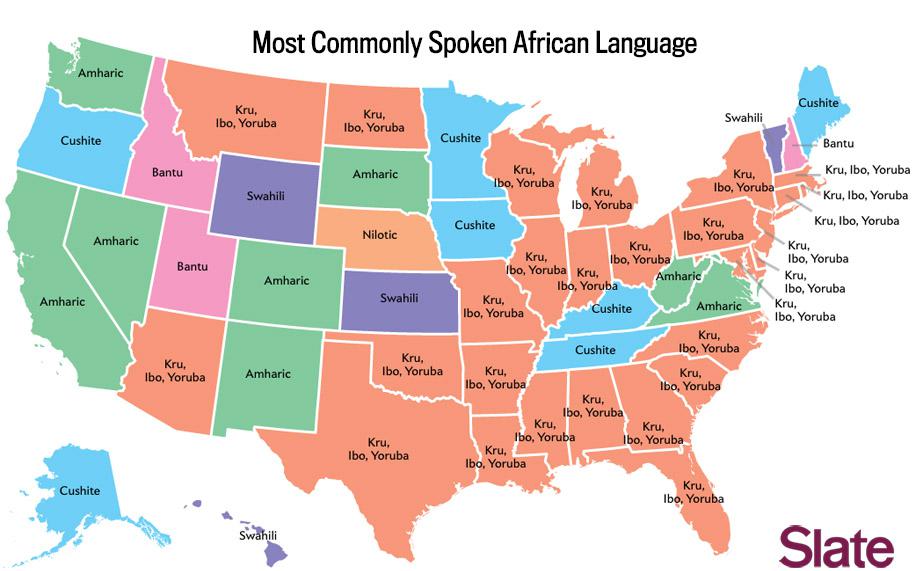
Data source: Census Bureau American Community Survey. Map by Ben Blatt/Slate.
See more of Slate’s maps.
Correction, May 13, 2014: This article originally misspelled Arapaho in the map of most commonly spoken Native American languages. (Return.)
Update, May 16, 2014: This paragraph was revised to clarify how the maps were constructed. (Return.)
Correction, May 27, 2014: This article originally misstated that only two languages categorized by the Census as Native American languages—Navajo and Dakota—were displayed in the “Most Commonly Spoken Language Other than English or Spanish.” It also included Yupik. (Return.)