
Each week, Transport for London, the agency that runs the London Underground in addition to the capital’s taxi licensing, stoplights, and more, records 19 million entries and exits at Tube stations. Enabled by the two-tone blue Oyster card that Londoners use at fare gates, this astounding amount of data informs everything from station design to train schedules. But it tells transportation planners virtually nothing about what happens during the 26.5 minutes that constituted, in 2015, an average commute on the Tube—a black box whose contents could help planners schedule trains, design stations, and plan for breakdowns.
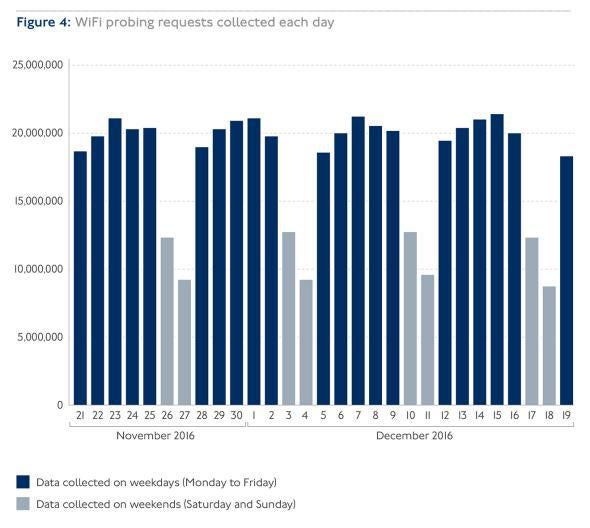
Last fall, TFL shined some light on that question, tracking the connections between straphangers’ cellphones and the system’s Wi-Fi routers. Over a period of four weeks, the agency recorded 500 million connections from more than 5 million devices at 54 stations around central London. Collecting and crunching that data cost just 100,000 pounds, or about $130,000. The results, which were released last month, paint an intricate portrait of how Londoners wait, walk, and navigate in the world’s 11th-busiest subway system.
TFL
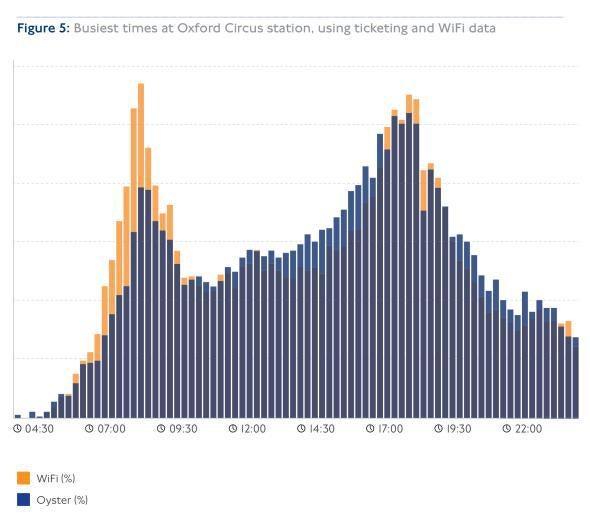
Take Oxford Circus. It’s a megahub where the Bakerloo, Central, and Victoria lines meet below the capital’s busiest shopping district. Oyster data show the morning rush as a small spike and the afternoon rush as a larger hump. But data from the Wi-Fi that TFL runs with Virgin Media show that the morning is just as busy: It’s just that a.m. commuters are transferring instead of entering or exiting. This suggests that nearby workers use a transfer to get to work but come home by accessing their line directly at Oxford Circus—perhaps reflecting an afternoon stroll or errand en route. At a station that periodically gets shut down for crowd control, TFL now has a better idea of where those crowds come from.
“We’re able to see all this,” says Lauren Sager Weinstein, the chief data officer at TFL. “When we ask people on surveys you just don’t get this complexity.” The old way was to pick a day to position employees with clipboards and counters to watch crowds ebb and flow as the trains arrived. But spot checks are an expensive way to view traffic during a very small window of time, subject to the caprices of the day: great weather, a breakdown here, a soccer game there.
TFL
With the Wi-Fi experiment, which TFL hopes to expand to the whole network, the commute comes into vivid color. One phone with Wi-Fi set to “on” could interact with a dozen routers on a trip, at entry, exit, and transfer points, but also as its owner passes through stations on a train. That allows TFL to measure crowding on individual trains. During the pilot, there was a lag of 20 to 40 minutes between a phone’s message to a router and that data getting crunched by the agency, but planners think they can eventually turn this into real-time information that could, say, tell a commuter which train is most likely to have seats available.
TFL says it used an irreversible encryption process, making it impossible to retrieve specific movement data for a particular device—a request that Scotland Yard would no doubt want to make. U.K. Information Commissioner Elizabeth Denham has praised the trial as a “good example of privacy by design.” This data scarcely reveals more about an individual’s big-picture travel patterns than that already collected at fare gates. Still, in turning down one freedom-of-information request for the encrypted dataset, TFL cited “the possibility that the pseudonymised data could, if it was matched against other data sets, in certain circumstances enable the identification of an individual.” (It had also pledged not to release the data to third parties.) Some privacy scholars worry that even anonymized data can be paired with other information, like cellphone records, to identify particular people.
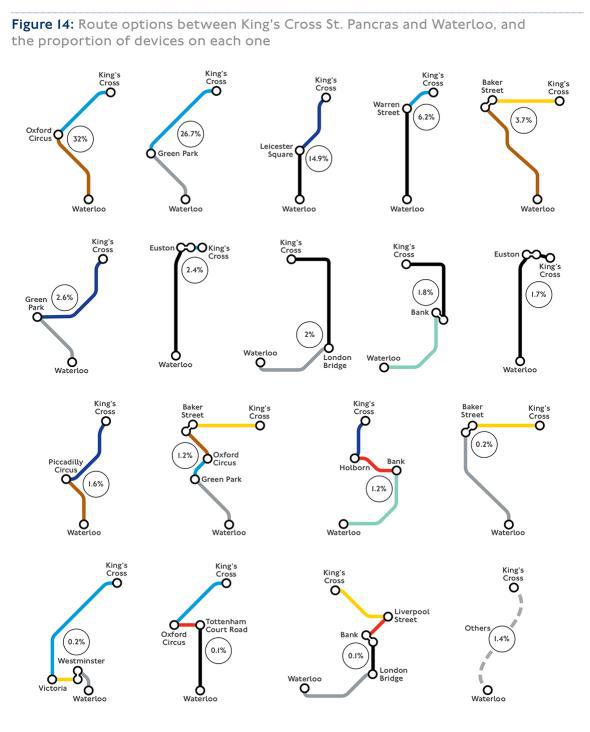
The results of the study illustrate the glorious redundancy of a good transit network. Travelers used 18 different combinations of lines to make a relatively simple journey from King’s Cross to Waterloo. Some of those routes were comically overcomplicated, desire paths of a trainspotter, but no single trajectory took more than a third of travelers.
TFL
That variation becomes crucial when something breaks down. A test case in TFL’s report concerns the shutdown of the Waterloo & City line during the morning rush in December. Wi-Fi data show exactly how passengers repositioned themselves on four alternate routes, and how that traffic impacted service and stations nearby.
It’s a novel approach with a huge potential upside, says Sarah Kaufman, a former data analyst at New York’s Metropolitan Transportation Authority who is an assistant director at New York University’s Rudin Center for Transportation. “You could make service adjustments based on where people are transferring,” she says. “Maybe adjust where express stops are based on number of people using those stations. Make certain stairways only one direction so that people can transfer more quickly between lines. And, of course, advertising is a huge sources of revenue and could be done very nicely by knowing where people are.” If you can show that half the straphangers making the A-C to 4-5 transfer at Manhattan’s Fulton Street station are headed for Union Square, you can sell the ad space in the passageway to, say, Paragon Sports, a sporting good store near their final destination.
Highly complex systems that do not see where travelers exit—like those in New York and Paris, for example—could leap ahead with detailed customer data. In 2019, New York is planning to shut down a crucial tunnel that carries several hundred thousand trips a day. The public authority that runs the subway has no good plan for how to accommodate those riders, and meager data on which to build one.
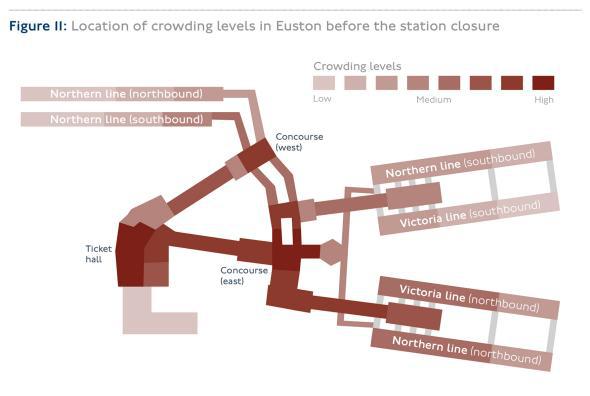
Because there were, on average, 20 routers in each station in the pilot, London’s data are quite fine-grained. The fact that nearly 30 percent of straphangers at Euston Station moving from the southbound Victoria line to the northbound Northern line take an elongated route through the main station concourse suggests there’s a wayfinding problem. During a particularly crowded evening when Euston had to be temporarily closed to entry, a three-minute walk from a platform to the concourse took 10 minutes. That same “footfall” information can also help TFL rent out commercial storefronts.
TFL
There’s a lesson here for governments and companies collecting data from constituents and customers: Make the benefits clear. In a series of focus groups leading up to the study, TFL found customer feedback to the idea was positive, especially when they felt it could improve their commute in tangible ways. In the lead-up, the agency ran the details in its daily travel page in the free newspaper Metro and put up hundreds of posters advertising the pilot. The agency says the Wi-Fi data will guide operations, schedules, and investments. Building a transit system to suit people’s needs is a lot easier if you know where they are.