Big changes are coming to JetBlue. Sometime in the first half of 2015, the carrier that prides itself on allowing customers to check their “first bag free” plans to introduce its first bag fee. The legroom on JetBlue’s Airbus A320 seats is shrinking as well, from its current 34.7 inches to 33.1, to make space for 15 additional passengers. Other amenities will remain, like the complimentary entertainment and those signature Terra Blues potato chips. But it’s safe to say that come next year, the JetBlue experience will not be as nice as it is right now—and that’s entirely your fault.
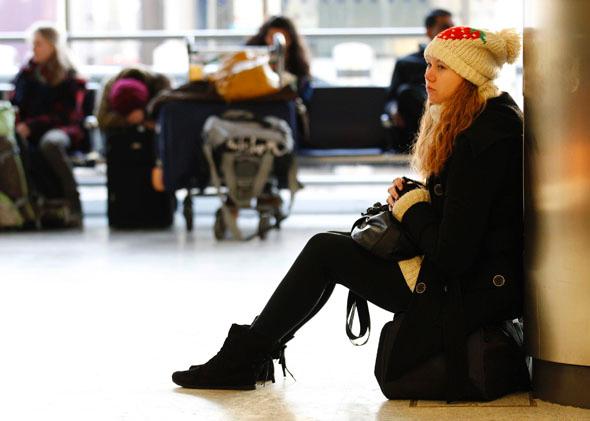
By the end of this holiday season, an estimated 45 million people will have packed onto U.S. airlines, many of them more crammed and disgruntled than ever before. In reducing legroom and adding fees for checked baggage, much of the industry has preceded JetBlue. Since airlines were deregulated in the late 1970s and new competitors streamed in, the industry has undergone a massive transformation. The decades-long fight for market share has led to no-frills, low-cost air carriers, which in recent years have become even cheaper and ever more sardine-like. Airplane seats, once 18 or 18½ inches in width, now span just 17 or even 16½ inches on some of the narrowest jetliners. Legroom has dwindled similarly on all carriers—down to 30-ish inches from 32 to 36 in the mid-1980s. (On the ultra-low-cost Spirit Airlines, it’s a cramped 28 inches.) And while the seats are getting smaller, the fees are piling on as airline after airline moves to “unbundle” costs. Gone are the days when your fare included basics like checking a bag and selecting a seat. Buying a plane ticket is increasingly like ordering a sandwich and having to pay extra for the bread.
Not surprisingly, the trends in the airline industry—smaller seats, fewer free amenities—have been met with growing customer frustration. This summer, a seemingly unprecedented bout of “recline rage” infected the nation’s air travelers, with multiple planes diverting to calm angry passengers. A quick glance at the data on passenger complaints to the U.S. Department of Transportation reveals that Spirit, perhaps the most notorious charger of “optional” service fees, is also by far the most reviled. In each of the past five years, the complaints per 100,000 enplanements on Spirit have been triple, quadruple, or even quintuple the complaint rates seen on most other carriers.
At the same time, customers haven’t started protesting with their wallets. For the second year running, Spirit is reporting the highest operating profit of all U.S. airlines. Allegiant Air, another super-cheap domestic carrier, is close behind. Americans might love the idea of better-quality flights, but they’re simply not willing to pay more to book one.
“There’s clearly a disconnect between some customers’ stated preferences and what actually matters most when they’re sitting down ready to make a purchase,” says Brian Davis, vice president of business development for Allegiant.
Over the past five years, ultra-low-cost carriers like Spirit and Allegiant have consistently outperformed their peers in terms of operating profit, the best measure of comparison. During the same period, airlines that promise a nicer experience for a slightly higher price have lagged behind. Virgin America, which seems to have something of a monopoly on the best domestic airline title in multiple rankings, bled money from 2010 to 2012 and has only started to catch up to its competitors over the past 12 months. JetBlue’s operating profits have been steady but mediocre since 2010; the changes to its seating and pricing are designed to bolster annual revenues and margins. “JetBlue has tried all these years to believe that even the lowest-paying passenger can have lots of legroom, a free checked bag, and everything else, but it just hasn’t worked,” says Seth Kaplan, an industry analyst and managing partner at Airline Weekly. “People will tell you, ‘I don’t like being nickeled and dimed, just give me a price—I’m willing to pay more just to not have to deal with all of that.’ But the data suggest that they’re not really willing to do that. Because if they were, JetBlue would be the most profitable airline in America, and not Spirit.”
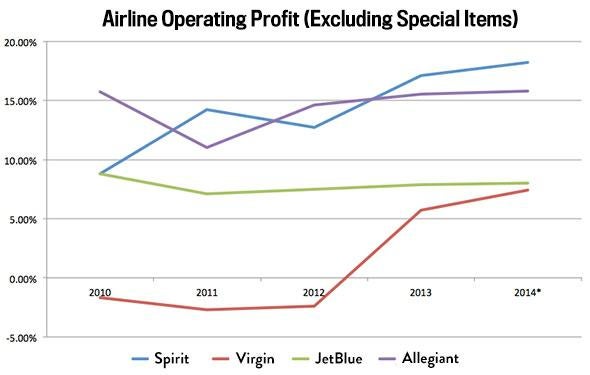
Data from Airline Weekly. 2014 numbers are Q4 2013–Q3 2014.* Chart by Alison Griswold.
That airlines like Virgin America and JetBlue can’t turn a strong profit while maintaining a better level of service speaks to the odd tastes of the American air traveler. As Matt Yglesias put it in Slate two years ago, “the basic moral of the story is that airline service is bad because customers want bad airline service. Or, rather, they don’t want to pay a premium for better service.” As far as consumer preferences go, this attitude is an outlier. The restaurant industry, for example, is well aware that diners are willing to spend more for what fast-casual Chipotle and Shake Shack serve up than for the stuff at Taco Bell and McDonald’s. “There’s a lot of customers who believe that every airline is the same,” says Paul Berry, a spokesman for Spirit Airlines. “They don’t think that way when it comes to restaurants … but they think the airline industry is different. And really, it isn’t.”
One possible explanation for this behavior: When it comes to expensive items like plane tickets, the price differentials just seem bigger. I ran through some of the numbers on the phone with Kaplan. To keep things simple, we decided to compare two airlines at different points on the pricing spectrum: JetBlue and Spirit. In the latest fiscal quarter, the average flight cost $164.80 on JetBlue and $84.50 on Spirit. JetBlue also collected an average $22 in additional fees, or so-called ancillary revenue, from its passengers, and Spirit another $54. Looking at those numbers alone, the average fare on Spirit is about $50 cheaper than on JetBlue. But to truly compare the services, you have to make a few adjustments. For starters, flights on Spirit tend to be about 20 percent shorter than those on JetBlue. Spirit also crams 178 seats onto the Airbus A320, while JetBlue’s current layout accommodates 150. When you factor these things in, it turns out that JetBlue would have to take in about $196 on average just to make the same revenue per passenger that Spirit does. By those standards, JetBlue’s flights are actually a better deal. But based on sticker price alone, they don’t necessarily feel like it.
In a paper published last summer on strategic consumer behavior, a pair of researchers found that advance, online purchases of discounted airline tickets were disproportionately made on higher-cost carriers. The finding, they wrote, “suggests that fares at the lowest percentiles are often sufficiently low regardless of the presence of strategic consumers, and that increased strategic consumer behavior has a limited effect.” In other words, lower the sticker price to a certain point, and consumers become less shrewd about their purchases.
That kind of complacency might explain why people keep flocking to ultra-low-cost airlines, in spite of their often-subpar service. For all the complaints that companies like Spirit get—and there are complaints galore—the market indicates that customers care more about cheap prices than anything else. Both Allegiant and Spirit say routine surveys of their riders support this conclusion. When passengers are asked how important they consider various aspects of airline service on their own, such as price, timeliness, and other factors, Allegiant’s Davis says they all score “pretty high.” When the options are pitted against one another, though—framed in terms of tradeoffs—price overwhelmingly wins. “The greatest service we can provide to them is keeping the fares low,” Davis says.
Correction, Dec. 24, 2014: The credit on the chart in this article originally stated that the 2014 figures represented Q3 2013 to Q3 2014. They are from Q4 2013 to Q3 2014.