After the initial dust of “106,185!” settled, I was left with a question about the Department of Health and Human Services’ report on last month’s Obamacare enrollment numbers: Which states did the best job of signing up their citizens for the new health care exchanges, and which states were the most miserable failures?
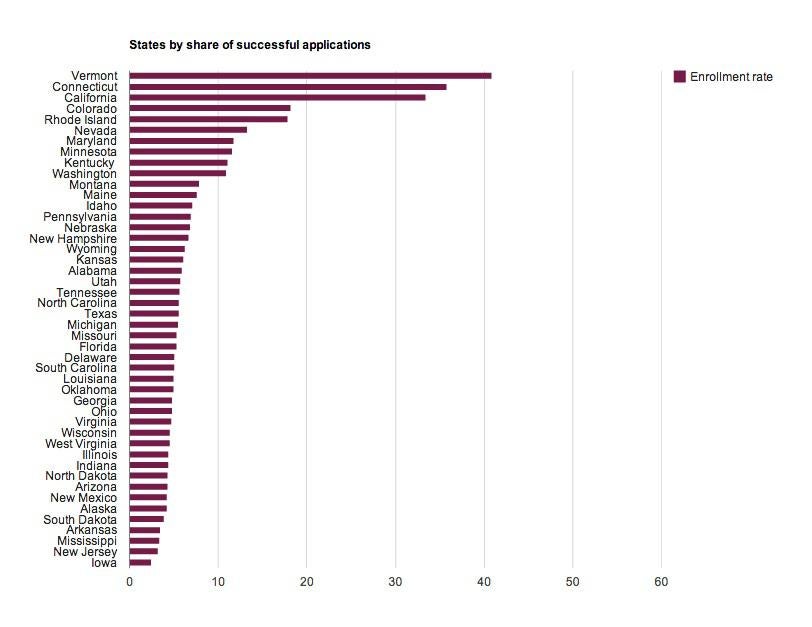
Hence, the chart you see above. I should note that this chart lumps in the states that use their own state-based exchange websites—like Covered California or Kynect in Kentucky—with the states that use the much-maligned healthcare.gov. The chart compares the total number of completed applications in each state with the number of individuals in each state who were actually able to select a health insurance plan in the marketplace.
Some states, like New York, unfortunately don’t have data available yet. But clearly, Vermont is winning the Obamacare signup race so far, with more than 40 percent of its applicants successfully choosing a plan. Connecticut and California also top out the list. What do these three states have in common? They all run their own exchange websites. Meanwhile, at the lower reaches of the chart, states like Iowa, New Jersey, and Arizona—all of which have sites that are either “supported or fully run by HHS”—were barely able to break the 5 percent mark.