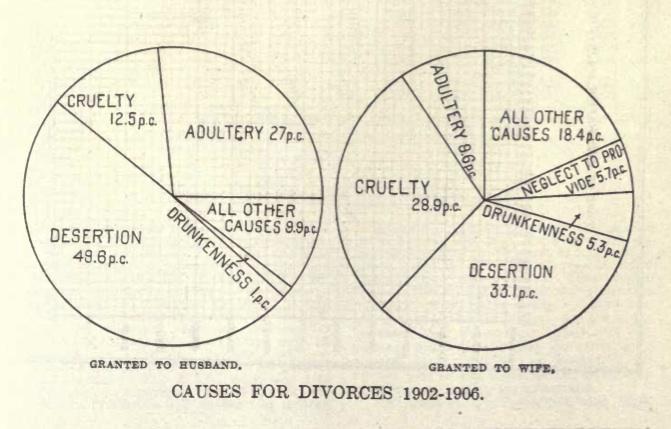
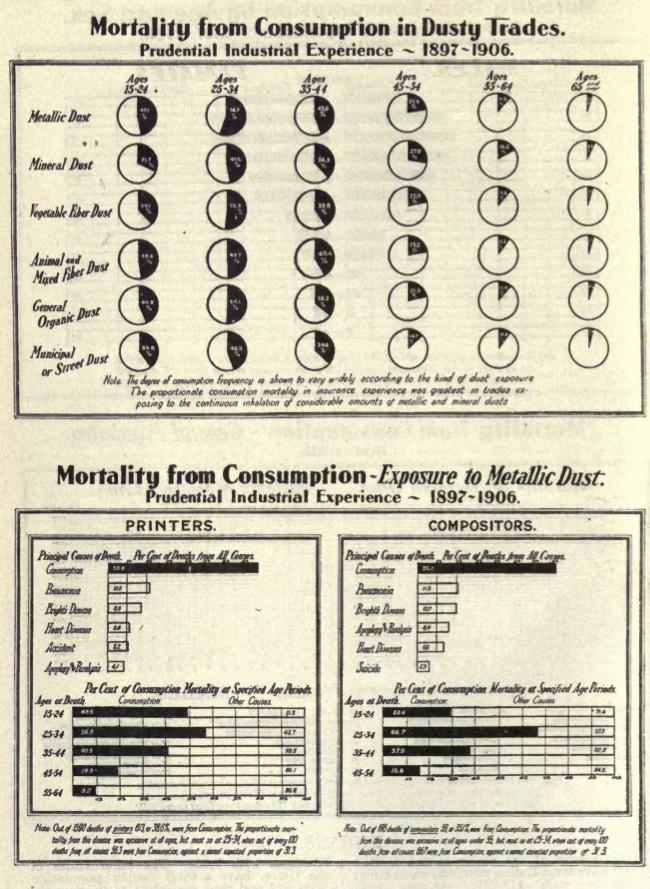
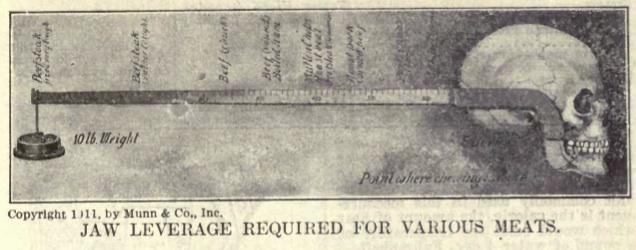
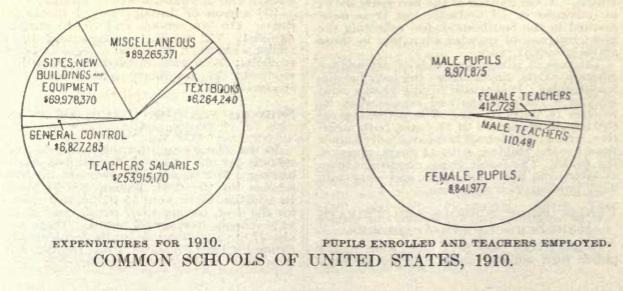
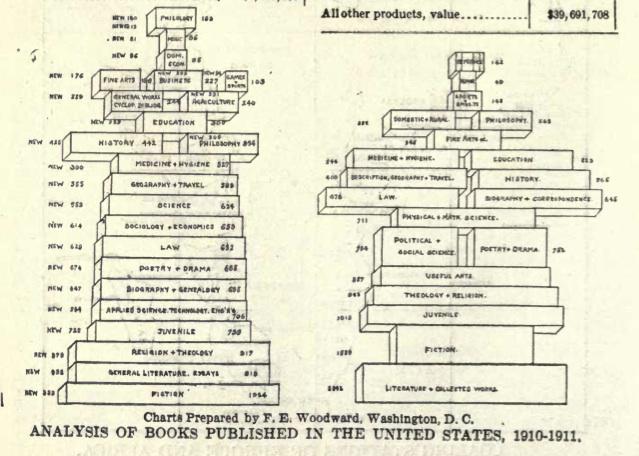
This group of infographics comes from the Scientific American Reference Book of 1913, compiled by Albert A. Hopkins and A. Russell Bond, which is available to read on the Internet Archive. They’re a delightful snapshot of the concerns of readers of the magazine a hundred years ago, as well as an interesting tour through infographic design strategies au courant at the time.
“The Editorial staff of the Scientific American receive annually about 15,000 inquiries covering a wide range of topics,” explained Hopkins in a preface. While the magazine had earlier published a Scientific American Cyclopedia of Receipts, Notes, and Queries (which did well, selling 25,000 copies), the book didn’t quite fill the needs of every reader; letter-writers wanted general information about the world, not just scientific formulas.
They wanted information about the Antarctic region, the Panama route, shipping, navies, armies, railroads, population, education, patents, submarine cables, wireless telegraphy, manufactures, agriculture, mining, mechanical movements, astronomy, and the weather.
First and second editions of this book were published in 1904 and 1905. (The 1905 edition is also available on the Internet Archive.)

Internet Archive
Internet Archive
Internet Archive
Internet Archive

Internet Archive
Internet Archive
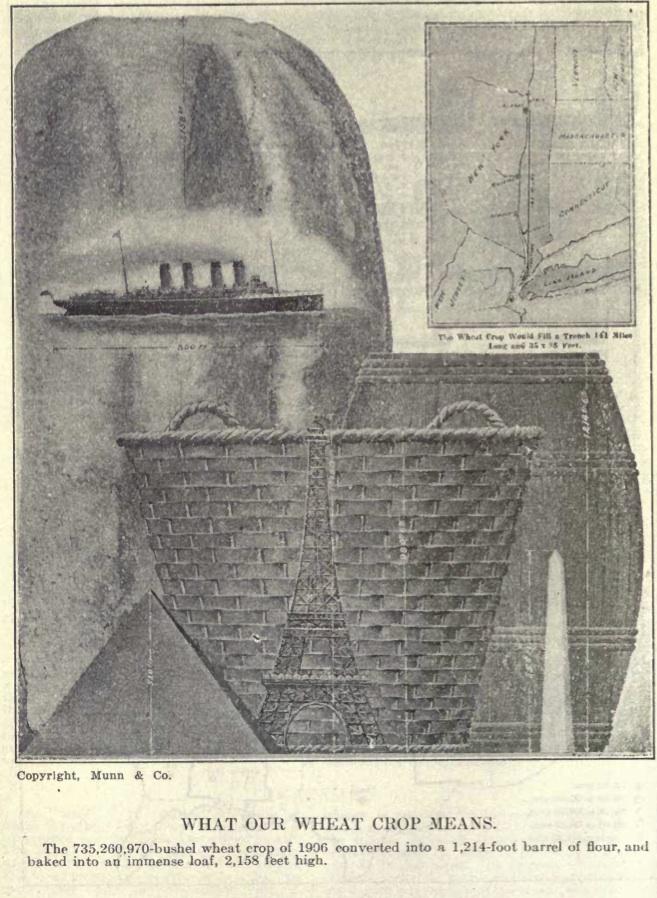
Internet Archive
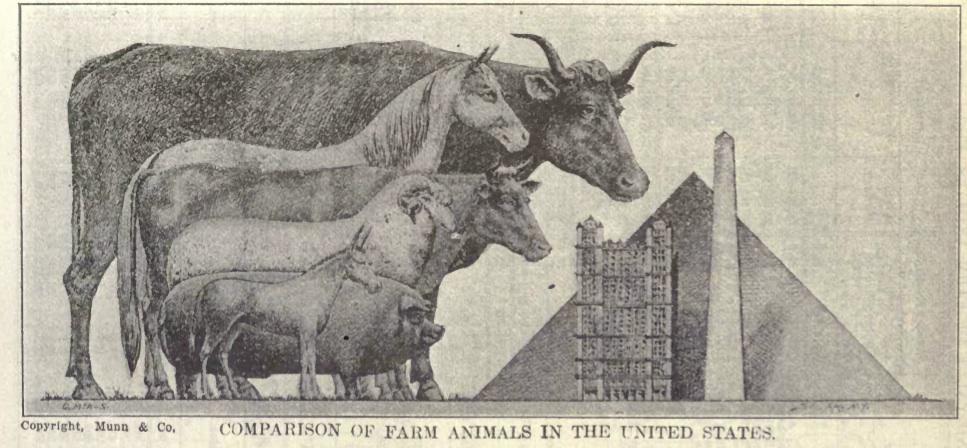
Internet Archive

Internet Archive
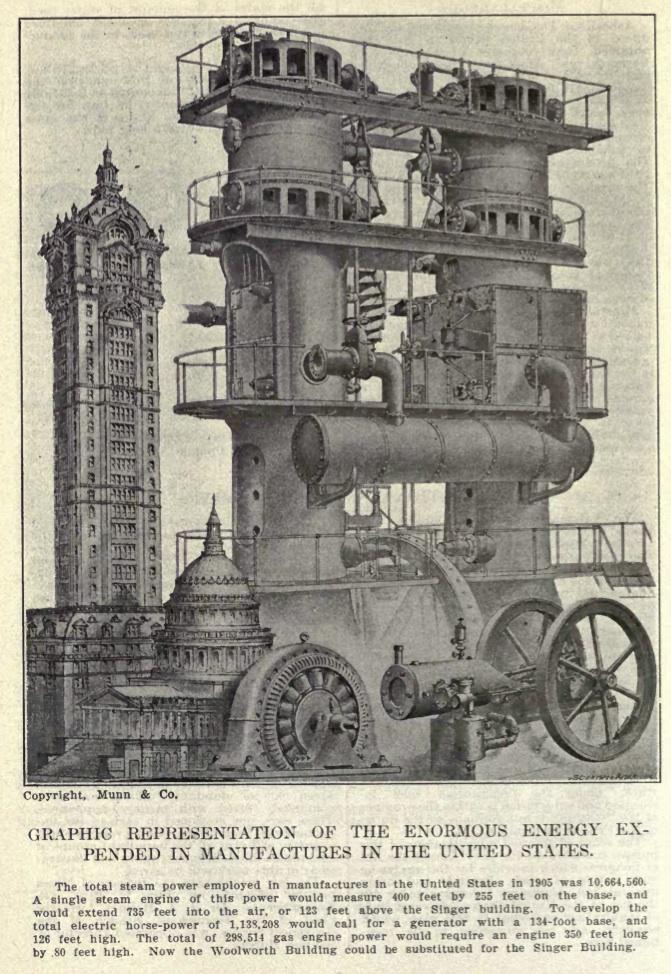
Internet Archive
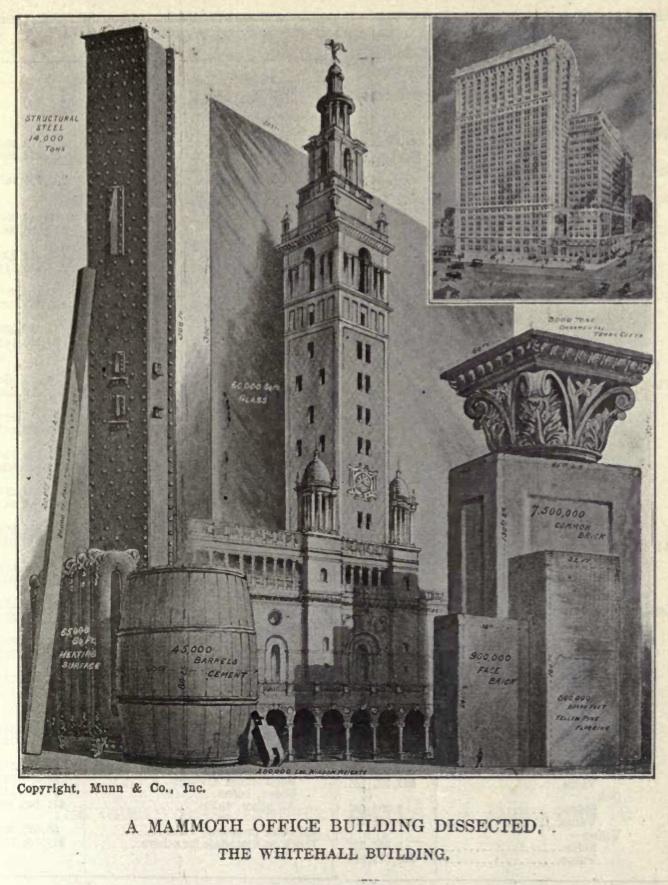
Internet Archive
Internet Archive