British businessman, philanthropist, and social reformer Charles Booth spent years gathering the data to produce these color-coded maps of London poverty, which he published as part of a huge project titled The Labor and Life of the People of London. (Labor and Life eventually comprised 17 volumes.) The library of the London School of Economics, which has produced an interactive mobile app with the Booth maps, has recently made this source material available in high-resolution files, via Flickr.
To glean the data he represented in the maps and his text, Booth first taped interviews done by the London School Board with families whose children were in the free school system, then sent investigators along with London policemen walking their beats. As the descriptions attached to the maps’ color classifications make clear, Booth was convinced that crime and poverty went hand in hand. (The poorest residents are described as “vicious, semi-criminal”; an 1892 reviewer of the second volume of Labor and Life described this class as “composed chiefly of elements of disorder.”)
As a result of his research, Booth became a long-time advocate for a program of state support for the elderly, which he thought would keep older people from slipping into a life of poverty and crime. He became a Privy Councillor after the completion of this project and was instrumental in the passing of the Old Age Pensions Act in 1908.
“The impact of Booth’s color maps was considerable, following the wide publicity which followed the publication of The Life and Labor of the People in London,” sociologists Martin Bulmer and Kevin Bales write. The plates influenced other reformers, including the residents of Chicago’s Hull House, to create similar “maps of poverty.” (Even more granular than Booth’s maps, which classify blocks by income level, the Hull House maps code for income on a house-to-house basis.)
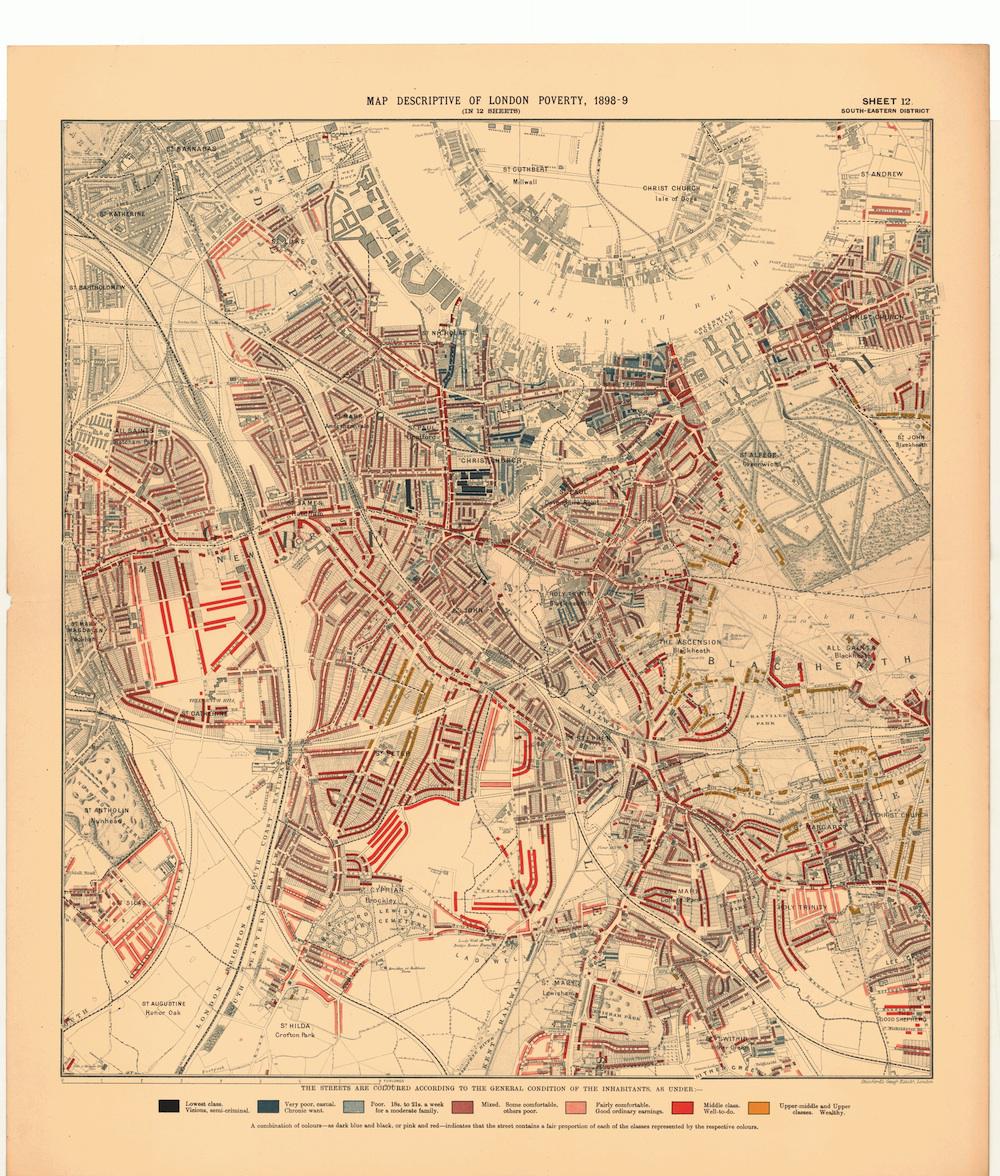
The maps below represent a third phase of Booth’s map-making. His first draft of this project, which covered a smaller geographical area, was published in 1889. He expanded coverage in 1891 and then revised the series with new data in 1898.
Click on the images below to reach zoomable versions, or visit the maps’ Flickr page.
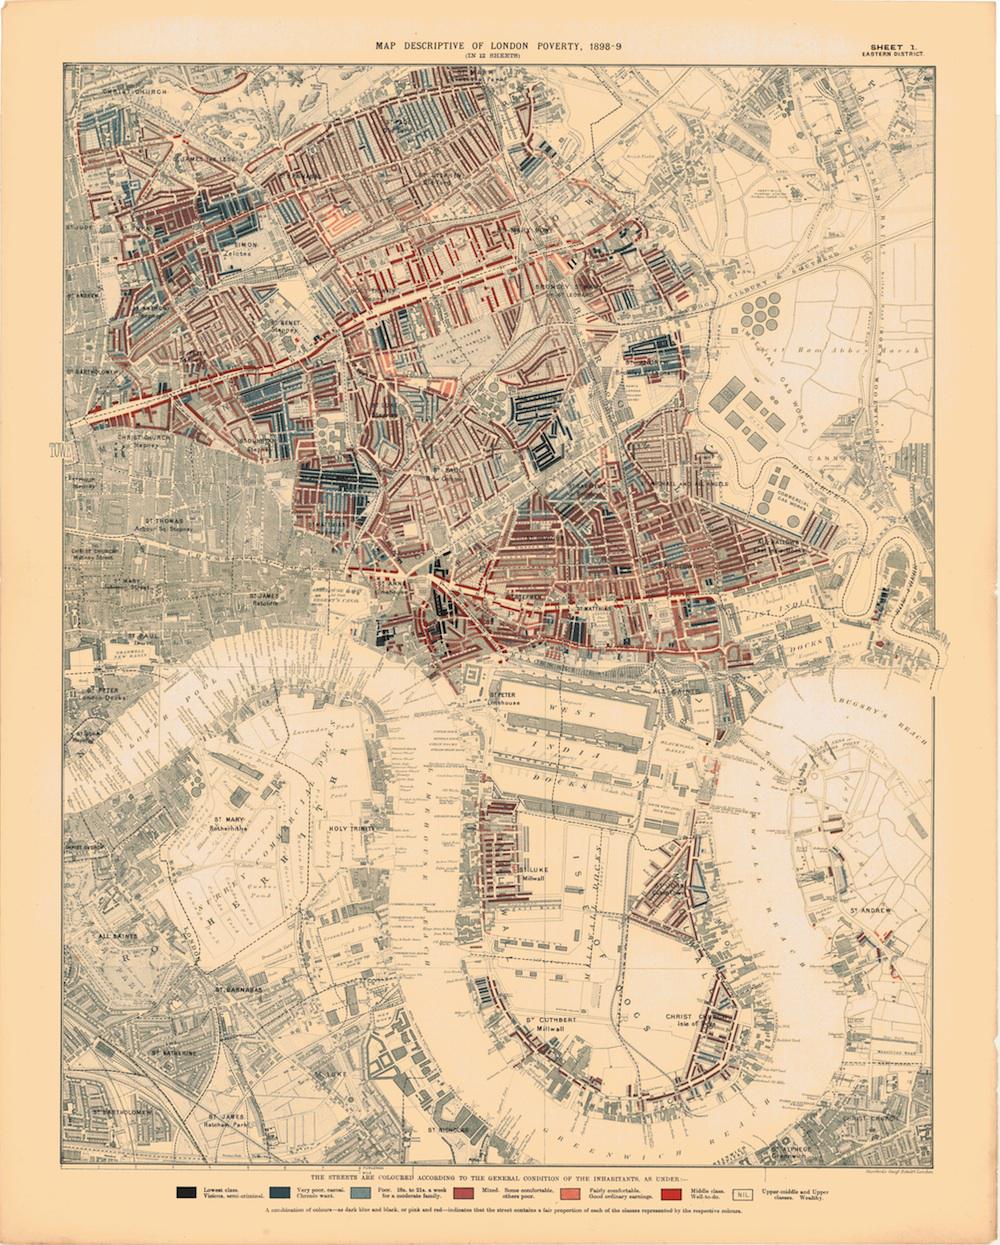
London School of Economics Library
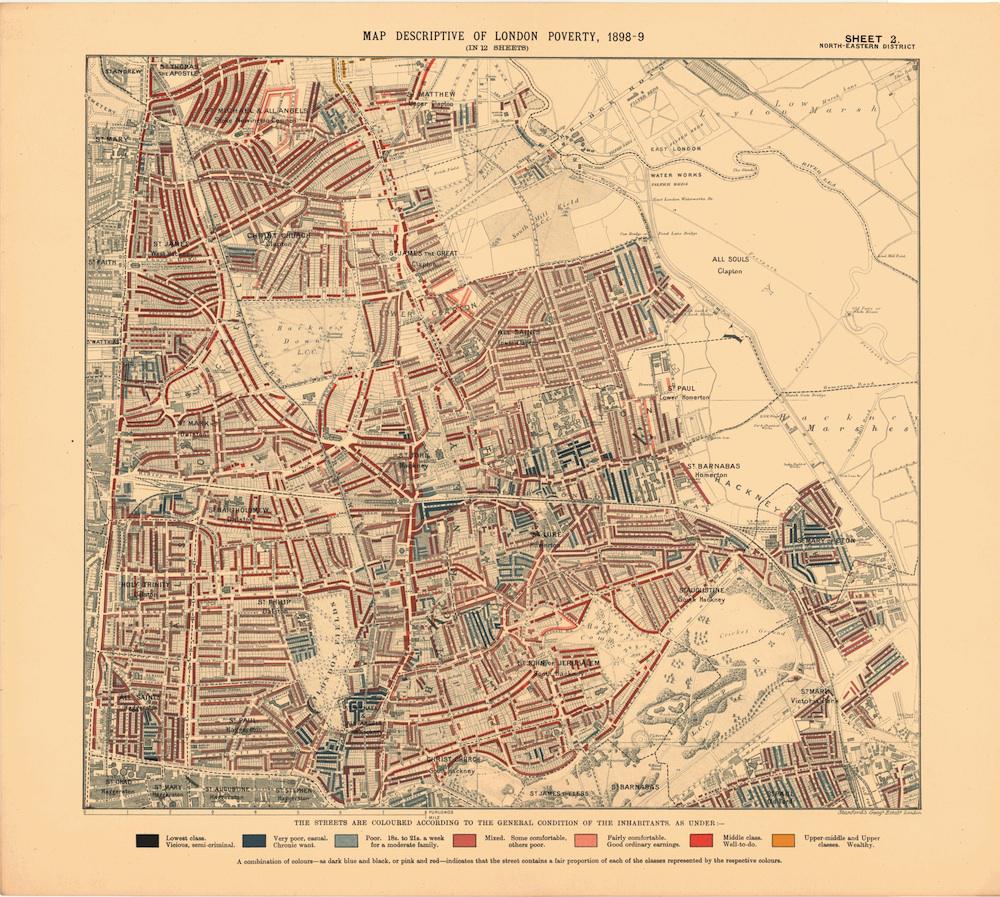
London School of Economics Library
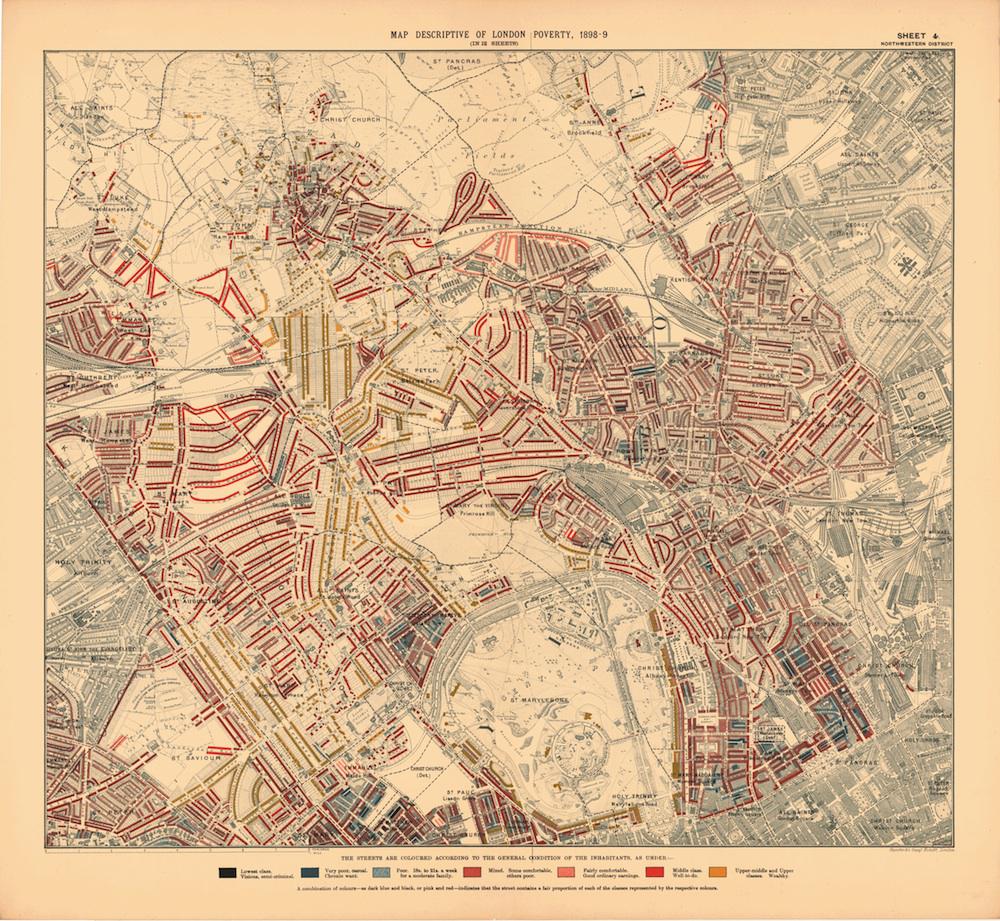
London School of Economics Library
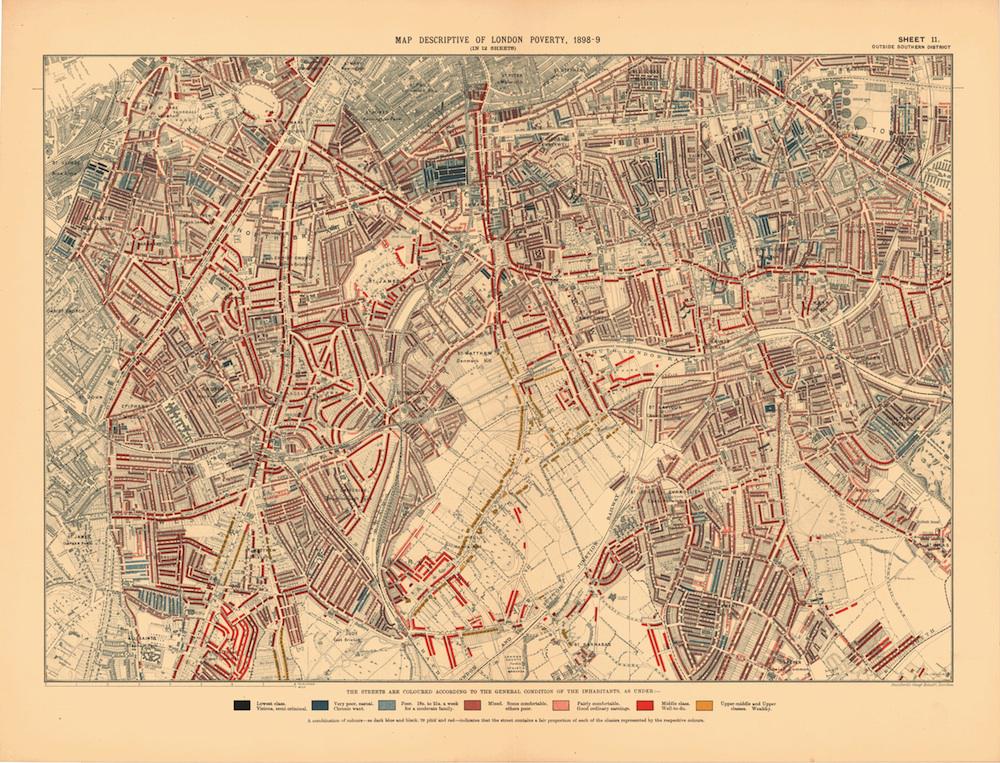
London School of Economics Library
London School of Economics Library