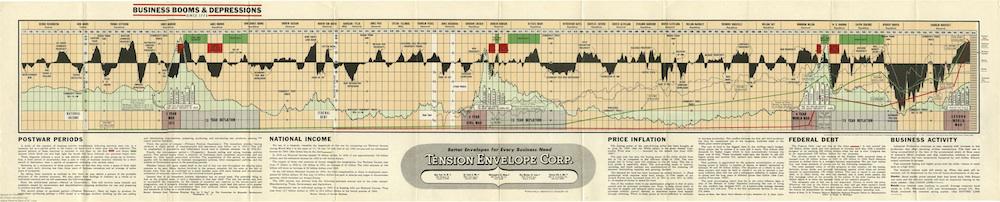
In 1943, as American businesses tried to guess whether wartime relief from the Depression would translate into postwar prosperity, the Tension Envelope Corporation printed this chart for customers. The infographic folded into a pamphlet and could be displayed on the wall when opened. (The online archive of the Federal Reserve, FRASER, has digitized a PDF of the pamphlet, which you can view here.)
The infographic and the explanatory text below it tap data from several sources, including U.S. Treasury reports, the Department of Labor’s Bureau of Labor Statistics, the Survey of Current Business, and the Committee for Economic Development, a nonprofit founded in 1942 to help American business plan for the postwar future. Excerpted text from a Committee for Economic Development publication, “Business Planning Now for V Day,” can be found in the lower left-hand corner of the chart.
In an explanatory section on the federal debt—represented on the chart as a red line that climbs steeply upward beginning in 1941—the chart’s authors articulate a strong stance on what could be an alarming indicator: “The necessary cost of this war is not important. Victory is worth the price. Whatever the cost to the future citizens is, they will get their money’s worth in benefits derived.”
Click on the image below to reach a large, zoomable version.
Via FRASER, the online Federal Reserve Archive.