The Vault is Slate’s history blog. Like us on Facebook, follow us on Twitter @slatevault, and find us on Tumblr. Find out more about what this space is all about here.
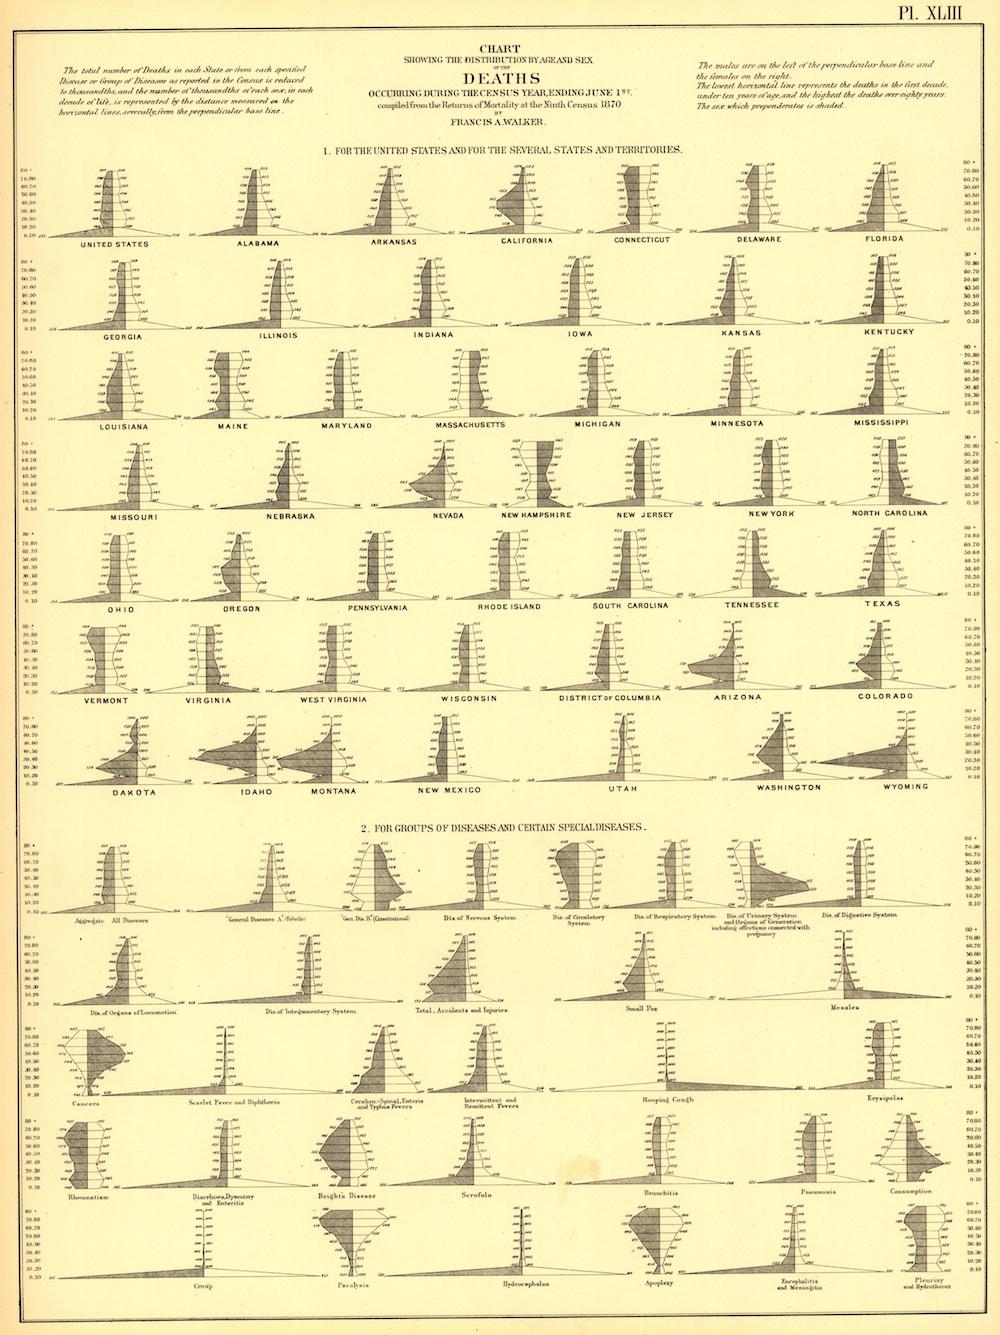
This set of charts shows causes of death in the United States, according to the 1870 census. The page appeared in the Statistical Atlas of the United States, a project spearheaded by Francis Amasa Walker, then the superintendent of the Census. Here, the atlas employs a data visualization technique described by Edward Tufte as “small multiples”—a series of little illustrations presenting bits of a data set.
Mortality rates by state are split into lumpy figures that convey age at death, along with gender. Men always appear on the left, with women on the right; the shaded gender is the one with the most individuals in the sample. The second part of the chart shows distribution of age and gender within populations dying of the named disease.
Generally, the figures representing mortality rates rest upon a pedestal of children’s deaths. That plinth is wider in some states than others. A pioneer state like Utah saw many young people die, while settled states like Vermont and New Hampshire, which were losing their young, child-bearing populations to frontier migration in the second half of the nineteenth century, had a more even distribution.
Diseases like “hooping cough” and croup follow the Utah pattern, with deaths concentrated almost exclusively in childhood.
Western states and territories—Dakota, Idaho, Montana, Wyoming—sprout lopsided spikes on the male side. The preponderance of men who died in their twenties, thirties, and forties might reflect the general roughness of life on the frontier, or might simply follow from their demographic’s overrepresentation in the general population.
Similarly, the figure representing the genders of those who died of “disease of organs of generation” skews female, while “accidents and injuries” leans to the male side.
Click on the chart below to reach a zoomable version, or click on the chart’s page in the Library of Congress’ digital archives.
United States. Census office. 9th census, 1870. [New York] J. Bien, lith., 1874.
Library of Congress.