The Vault is Slate’s history blog. Like us on Facebook, follow us on Twitter @slatevault, and find us on Tumblr. Find out more about what this space is all about here.
In 1900, W.E.B. Du Bois, along with collaborators Thomas J. Calloway and Daniel Murray, planned and mounted an exhibition on the state of black American life for that year’s Paris Exposition. The exhibition consisted of charts, books, maps, and photographs (here’s a photograph of the exhibit as it would have looked to a visitor). While the Library of Congress has long offered digital access to the photographs shown in that display, they’ve just recently added scans of 57 hand-drawn charts to that digital collection.
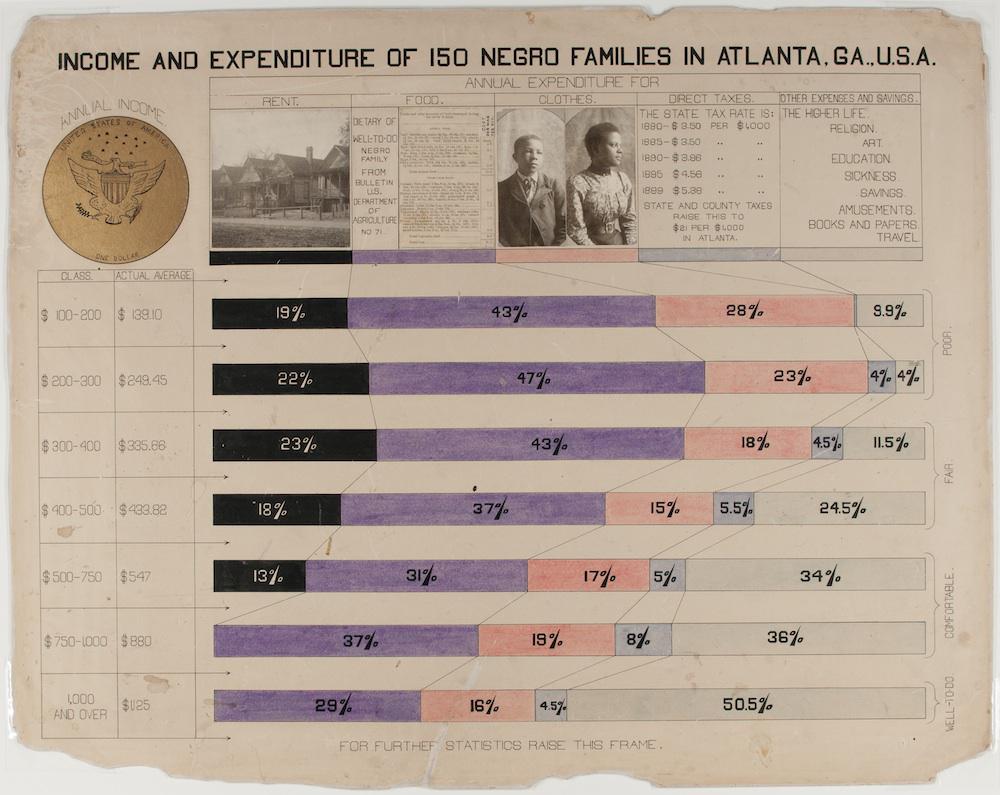
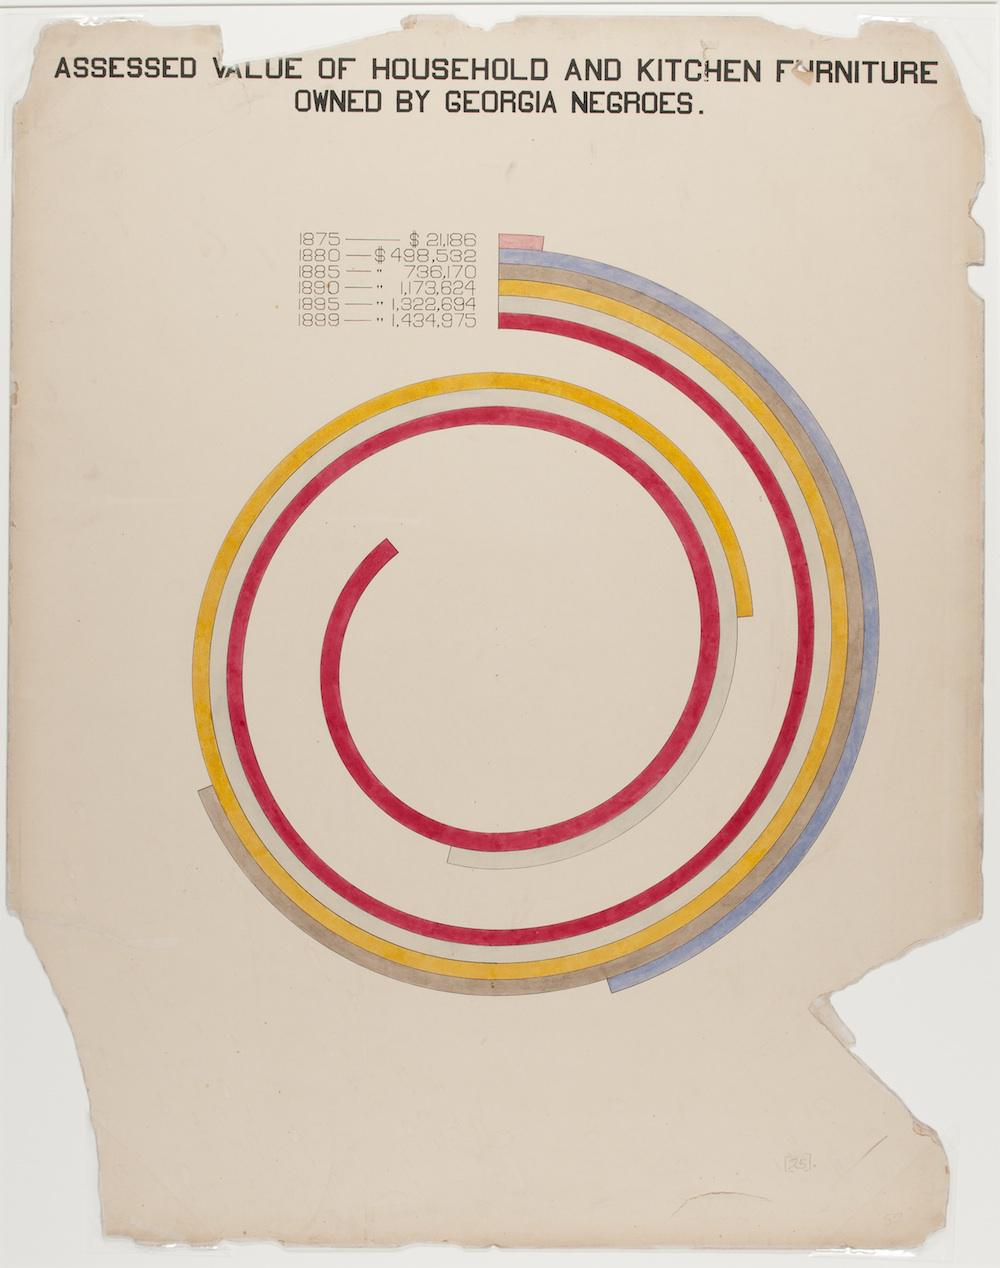
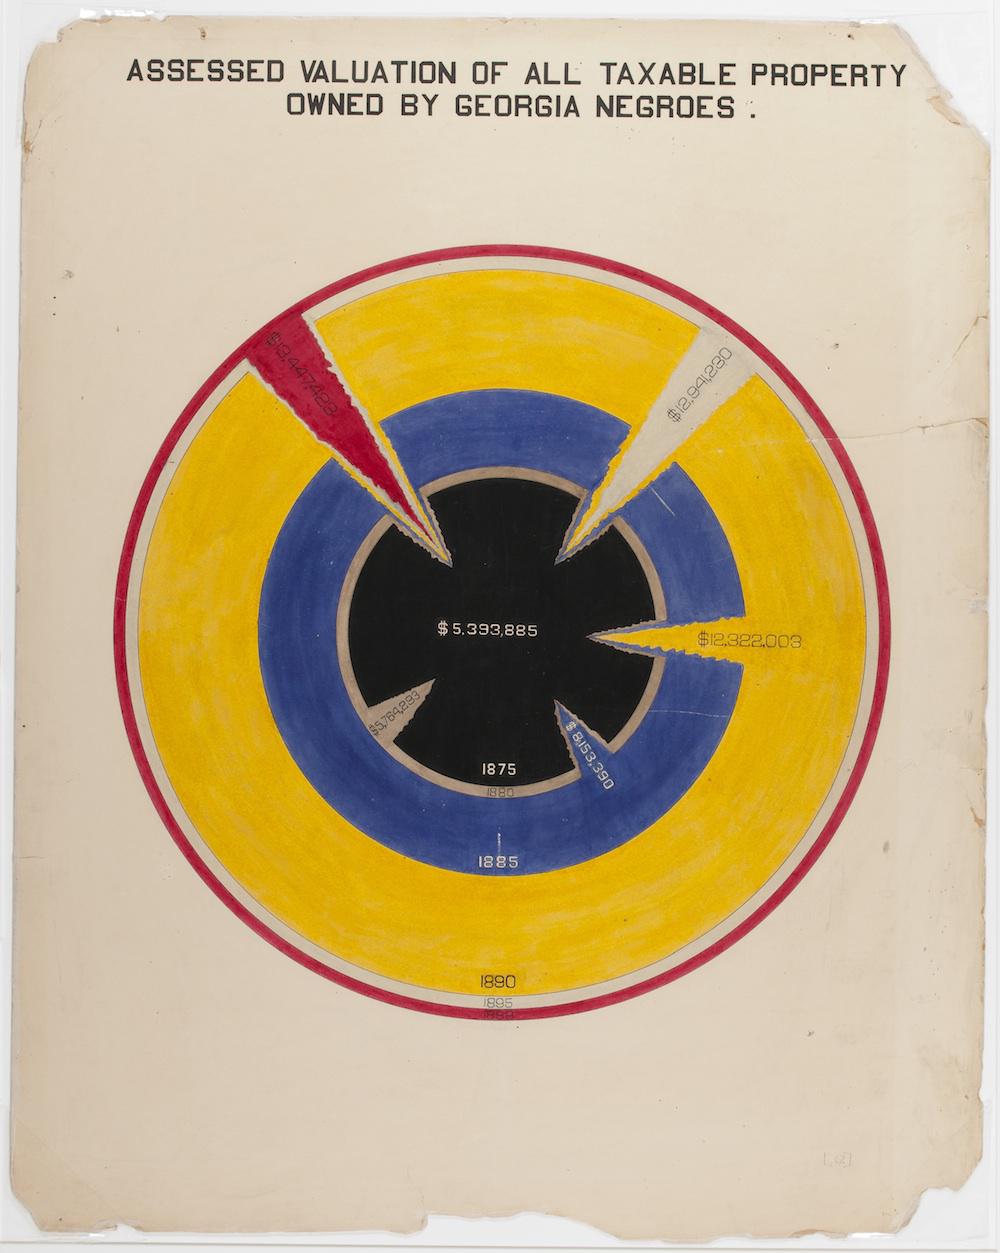
These documents, executed with help from some of Du Bois’ students at Atlanta University, give a statistical picture of the life of African-Americans at the turn of the century. The charts below are part of Du Bois’ “Georgia Negro” project, a subsection of the larger exhibit that looked at the African-American population in Georgia. I selected these three charts to show how Du Bois represented the economic situation of his sample; other topics covered in the remaining charts include literacy, “conjugal condition,” and migration patterns.
In his website about Du Bois’ involvement with the Paris Exposition, historian Eugene F. Provenzo, Jr. writes that Du Bois was disappointed with the general quality of the other exhibits housed in the sociology section of the exhibit, finding them unscientific. Du Bois’ statistics were drawn from his own empirical work, and assessed measures of property ownership, employment, health, and mobility across decades.
Click on the images below to reach zoomable versions.

Library of Congress.

Library of Congress.

Library of Congress.