The Vault is Slate’s history blog. Like us on Facebook, follow us on Twitter @slatevault, and find us on Tumblr. Find out more about what this space is all about here.
This chart takes a retrospective look at the results of medical examinations performed on prospective Union soldiers during the Civil War. The chart divides total results by conscript’s occupations; its bars show ratios of rejected conscripts to total people examined within each occupation. The chart was included in a report published by the Army’s Provost Marshal General’s Bureau, authored by Jedediah H. Baxter and printed in 1875, that tapped information about 1 million total medical examinations.
As I wrote in a past post about a map of the incidence of syphilis that was also included in this report, in the postwar era information gathered about prospective Union soldiers became fodder for new government efforts to represent and analyze data. Other charts coded rejected soldiers by disease and by geographical location.
In his history of a Civil War hospital, physician Ira Spar describes some Union Army medical exemptions. Poor vision and hearing; loss of limbs, fingers, or toes; orthopedic issues (“permanent extension or flexion contracture of any finger except little”); and bunions could all lead to disqualification. Spar points out that “absence of teeth” was “a major cause for exemption,” as “biting off the end of a powder cartridge was necessary to load a rifle.”
Looking at this chart, we don’t get details correlating disease with occupation, and are left to ponder just what the relationship between occupation and medical exemption might be. Later in the war, after the institution of a Union Army draft, some exemptions were probably the result of bribes or string-pulling—but these numbers incorporate pre-1863 results as well.
Why would upholsterers, brokers, and watchmen be so commonly exempted? Why were editors—a relatively small occupational class, with only 73 prospective soldiers examined—rejected at such a high ratio? The professional occupations, considered as a class, were exempted at a higher rate than the less-skilled groups. Does this number reflect the relative physical weakness of those in the professions, or was corruption at work?
Click on the image below to reach a zoomable version. Thanks again to historian Susan Schulten, who wrote about this report in her Mapping the Nation: History and Cartography in Nineteenth-Century America.
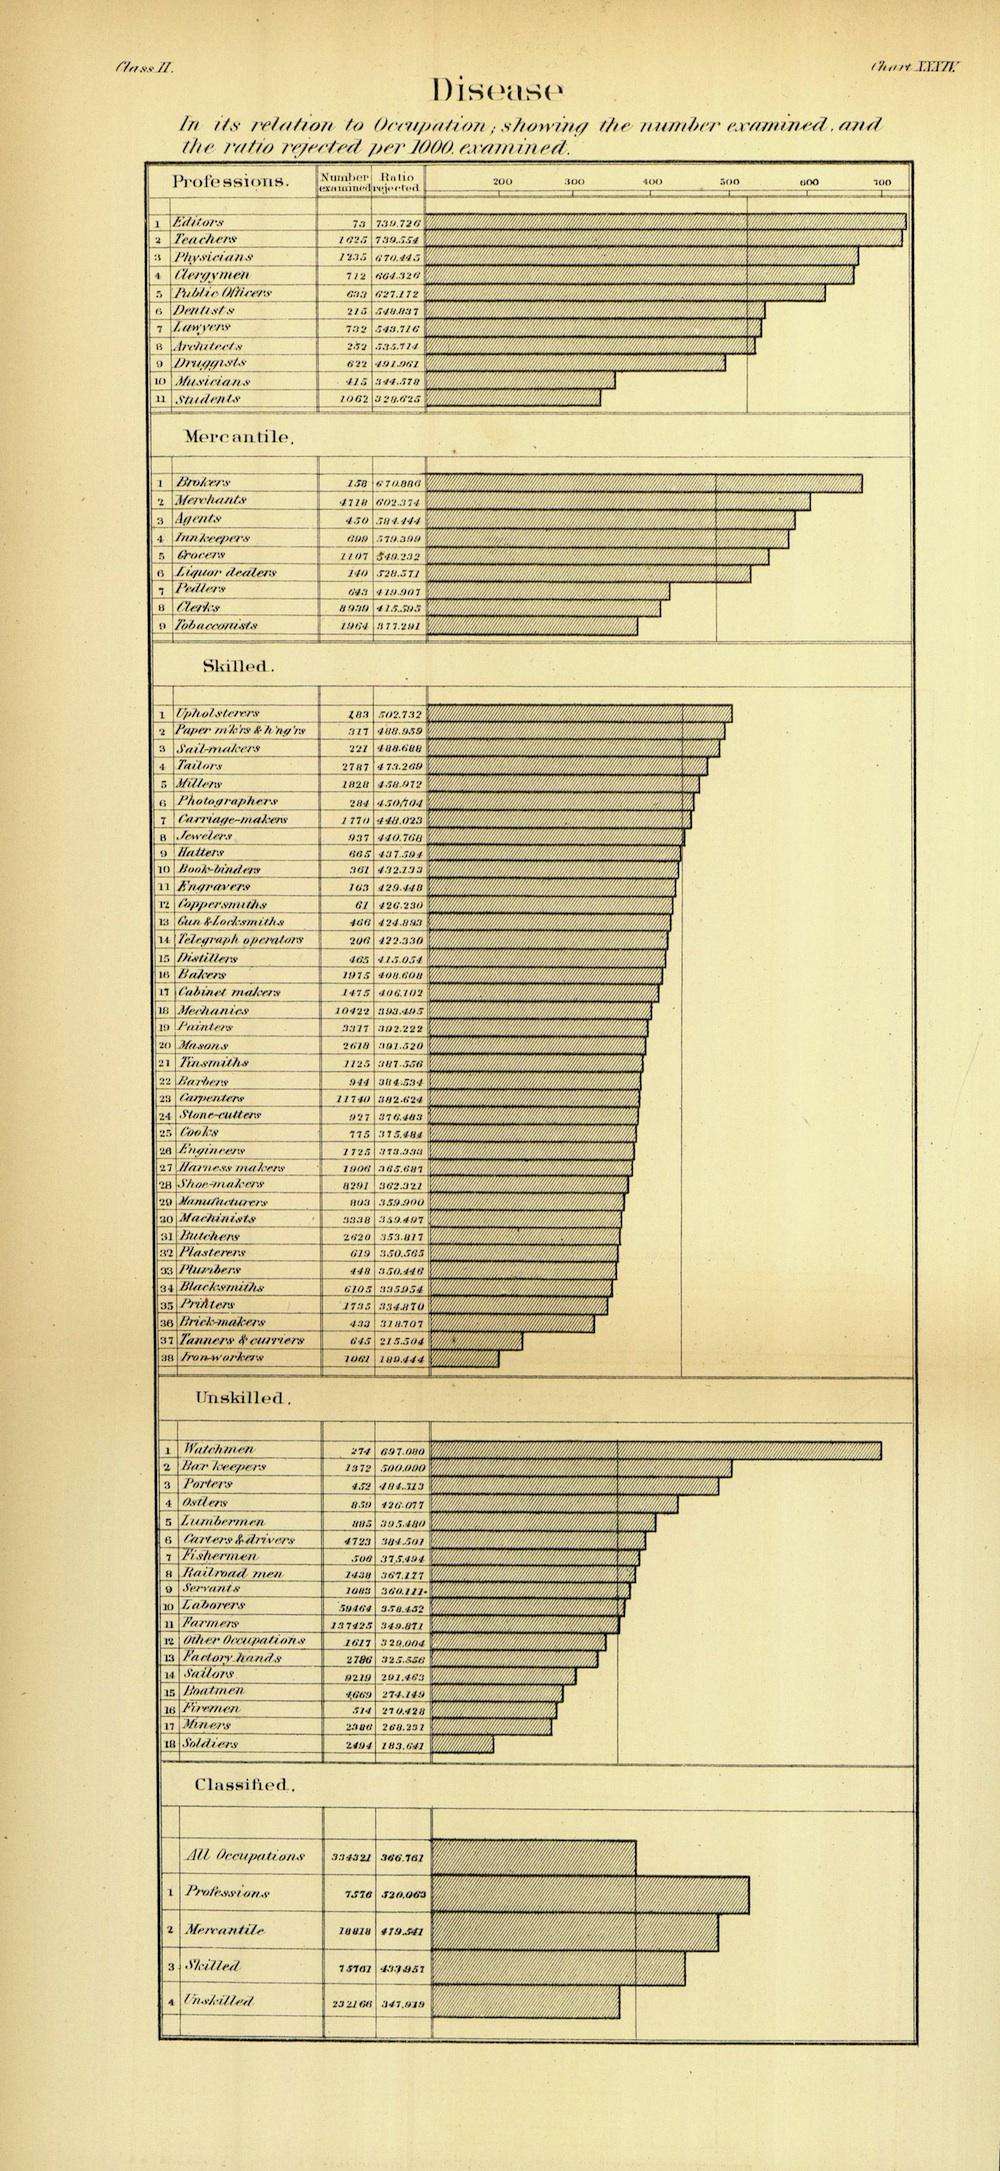
Image via the Digital Repository of the University of Denver Libraries.