The Vault is Slate’s new history blog. Like us on Facebook; follow us on Twitter @slatevault; find us on Tumblr. Find out more about what this space is all about here.
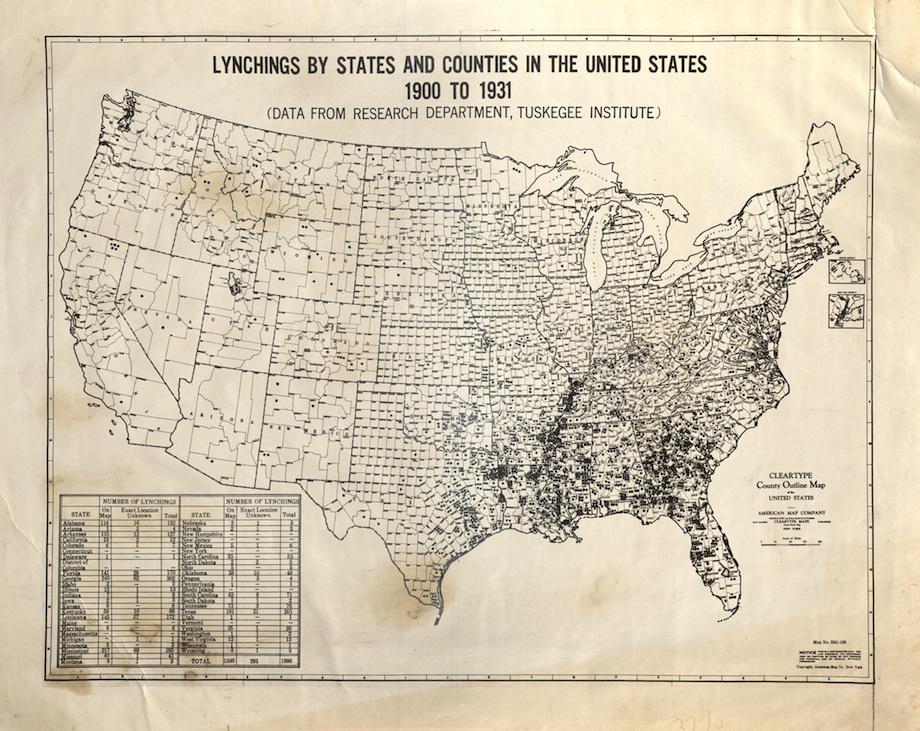
This map, compiled using data gathered by the Tuskegee Institute, represents the geographic distribution of lynchings during some of the years when the crime was most widespread in the United States. Tuskegee began keeping lynching records under the direction of Booker T. Washington, who was the institute’s founding leader.
In 1959, Tuskegee defined its parameters for pronouncing a murder a “lynching”: “There must be legal evidence that a person was killed. That person must have met death illegally. A group of three or more persons must have participated in the killing. The group must have acted under the pretext of service to justice, race or tradition.”
In 1900-1931, Georgia led the lynching tally, with Mississippi, Texas, Louisiana, Florida, Alabama, and Arkansas rounding out the top seven worst offenders.
These numbers can seem antiseptic. Upon the release of the Tuskegee Report in 1916, the Cleveland Plain Dealer sought to put a face to the statistics by describing the relatively minor crimes that provoked some of the year’s lynchings (while noting that at least four of the people killed were later proved innocent):
One was charged with being accessory to burning a barn. One was accused to [sic] stealing cotton. A family of four, including two daughters, was slaughtered for clubbing an officer. Three were lynched for poisoning mules, and two for stealing hogs. Two were strung up for furnishing ammunition to a man who was resisting arrest.
Tuskegee compiled statistics on lynchings through 1961. This print of the map is held at the Amistad Research Center at Tulane University; another copy is collected at the Library of Congress.
Thanks to Andrew Salinas of the Amistad Research Center, Tulane University.
Courtesy of The Amistad Research Center, Tulane University.