
On Thursday, the U.S. Census Bureau reported that the population of New York City had jumped up by 21,000 people between July 2015 and July 2016 to 8,537,673.
It’s a new all-time high for America’s largest city—albeit not as high as the all-time high of 8,550,405 we thought we hit on July 2015.
New York’s not shrinking. But statisticians at the Census now think they overestimated the prior growth of New York and a handful of other big cities, including Los Angeles, Chicago, and Houston. In New York’s case, the 2015 estimate was too high by nearly 35,000 people. Based on the latest estimates, the growth rate of large U.S. cities has dropped below that of the suburbs.
Thirty-five thousand is not a big error for a city of more than 8 million; it’s not even a half of one percent of the total. Still, the annual population estimate is closely watched by newspapers, politicians and boosters, and serves as a civic blood pressure check.
This is especially true for a city like Chicago, where the Census estimate can mean the difference between growing and shrinking. In 2016, for example, the Census estimated that Chicago’s population had fallen, in 2015, for the first time in the decade. This year’s estimates project the turnaround was evident a year earlier, in 2014. Last year, Philadelphia could still claim to be America’s fifth-largest city. The newest release shows that it’s not anymore—and in fact, had already dropped to sixth place in 2015, when Philadelphians were still (mistakenly) celebrating their last days in the top five. Why? Because the Census now thinks they underestimated Phoenix’s 2015 population by 20,000, and overestimated Philly’s by 3,000.
Those are small changes. They’re new for this decade, but not unprecedented. But the story behind the annual estimates the bureau makes between its more reliable decennial population count tells us something interesting about how population is measured, and how crucially important the 2020 Census—which is currently facing the prospect of turmoil, as so many federal agencies are, thanks to the Trump administration—is to understanding the way America is growing right now.
Here, courtesy of the migration researcher Lyman Stone, is data on the latest course correction for the five biggest Americans cities whose population trends have been corrected downward:
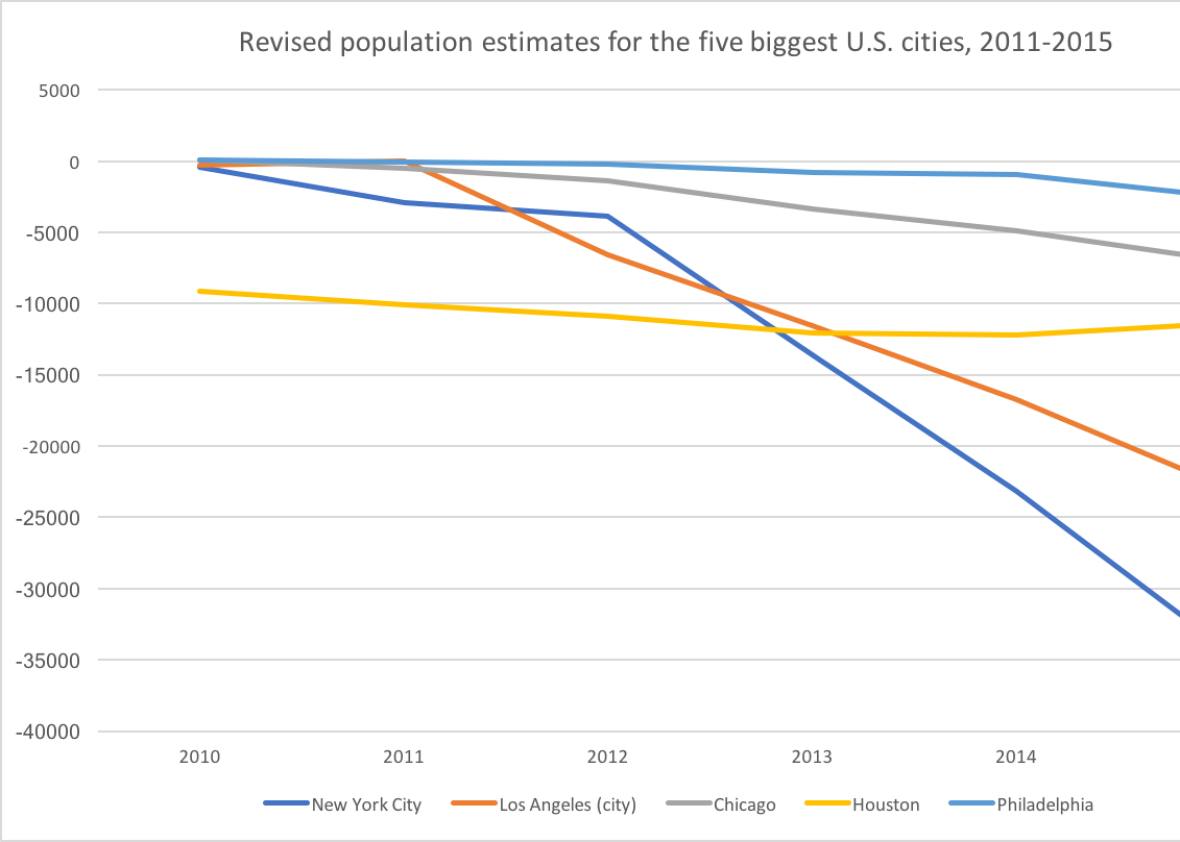
Data from the U.S. Census 2016 sub-county estimates, via Lyman Stone.
What’s going on here? Part of it, Stone thinks, is that the Census has changed the way it thinks about foreigners leaving, resulting in population downgrades for dense, immigrant-heavy counties. In a note explaining the change in the 2016 methodology, Census researchers note that “foreign-born emigration will be higher and net international migration will be lower than the previous vintage.” It’s a one-time correction, but it appears to make a difference—especially in the dense metropolises where there’s no growth without immigration. With the latest methodology, New York City’s five-year population growth between 2010 and 2015 drops from 4.6 percent to 4.2 percent.
The counties whose estimates were off by the most, Stone shows, were those with more than 2,000 people per square mile. It’s another drop in the bucket of evidence that America is not, in fact, getting more urban. Not surprisingly, the county with the biggest revision in absolute population was America’s largest, Los Angeles County. Its five-year population growth from 2010 to 2015 is now thought to be 3 percent, down from 3.6 percent. Compounded over time, for a county of more than 10 million people, that’s a big difference.
But that doesn’t tell the whole story. To give its ballparks of county population, the Census looks at births, deaths, and migration data from the American Community Survey and the Internal Revenue Service. Sometimes, county and city boundaries are coterminous, which means those sophisticated methods can be used to estimate population growth in the cities of New York, Baltimore, and San Francisco.
But in most cases, big urban counties contain dozens if not hundreds of cities. So to figure out whether more people are living in Long Beach, Beverly Hills, or unincorporated areas of L.A. County, the Census tries to figure out where new housing units are being built, and multiplies the number of new units by the occupancy rate and average household size. From there it comes up with its growth figures for different jurisdictions.
But as everyone knows, housing growth isn’t evenly distributed across city lines. In 2012, for example, the sociologist Chris Briem criticized the Census for assuming that the population of cities and suburbs was growing in proportion to what it was in 2010. That Census release produced a big wave of headlines about urban growth that later appeared to be unfounded. In the years since, the Census has reverted to the more precise tactic of measuring housing stock growth.
Still, that can be difficult. In Omaha, for example, the Census once assumed that 100 percent of reported housing stock growth was happening within the city, when it was in fact happening mostly in an “extra-territorial jurisdiction” in the suburbs. As a result, the 2010 Census showed the city’s population was 40,000 people lower than estimates had predicted—a difference of nearly 10 percent.
So the declining projections for urban population growth aren’t all about emigrants. They’re also about measuring housing stock growth, which comes down to the geographic distribution of building permits. Harris County, Texas, saw its 2015 estimated population reduced down from 4.538 million to 4.533 million, a small adjustment. But Houston, which is within Harris County, saw its 2015 estimate fall by twice that number, from 2.296 million to 2.285 million. Houston’s estimated population growth is probably slowing because, in addition to revised estimated for Harris County, its new housing growth is slowing. Maricopa County, Arizona, saw its 2015 population estimate fall by 7,000 people—but the estimate for Phoenix, its principal city, rose by 20,000! County-level adjustments don’t tell the full story.
The big news from this year’s estimates is that Seattle is the fastest-growing big city in America. For pro-growth urbanists, it feels like proof that the city’s massive construction boom is making it a more popular destination.
The same is likely true in Pittsburgh, which looks like it is holding steady even as the Allegheny regional population continued to decline. Why does Pittsburgh look like it’s in good shape? Probably because its new residential building permits leapt up in 2015.
The lesson here? Be wary of all trend articles about urban and suburban population growth. There’s no margin of error for Census estimates, but the average difference between population estimates and the 2010 Census was 3.1 percent. That’s pretty good after 10 years of population change, and tens of millions of new Americans. But it’s a reminder that every urban and suburban growth number you’re reading today is an estimate.
We think cities like Seattle are growing. But all we know for sure is that they’re building.