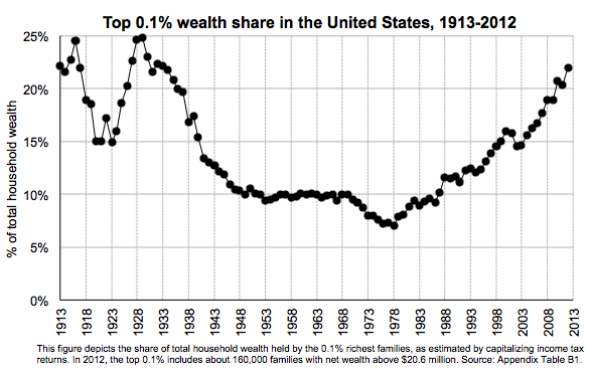
The door is just about to shut on 2014, so I wanted to take this last opportunity to fulfill my solemn obligation as an econ blogger and nominate my favorite graph of the year. No other image, in my opinion, so succinctly captures the skyrocketing fortunes of America’s super-rich than the chart below, included in an October working paper by economists Emmanuel Saez, of the University of California–Berkeley, and Gabriel Zucman, of the London School of Economics and Political Science (who you may know as some of Thomas Piketty’s favorite academic bandmates). In 2012, the top 0.1 percent of taxpayers lay claim to 22 percent of U.S. wealth, up from about 7 percent in 1979. Or, as I put it when I wrote about a rough draft of their findings in April, one-thousandth of the country now owns more than one-fifth of its wealth.
What does this graph tell us that we didn’t already know? A lot. For a long while, there was something puzzling about our statistics on economic inequality. The data showed that the top 1 percent of earners were gobbling up a larger and larger share of U.S. income over the past three decades, yet had not vastly increased their share of U.S. wealth. How could that be? Well, it was possible that America’s moderately rich were blowing away their paychecks trying to keep pace with the super-rich. Also, it takes a while to accumulate assets, even if you’re earning money hand-over-fist—so another answer was that the wealth gap might just be a lagging indicator of our economic polarization.
But Saez and Zucman suggest that there wasn’t much of a puzzle to be solved at all. We just weren’t looking at the data the right way.
The U.S. doesn’t tax wealth directly, so economists have long had to rely on somewhat roundabout methods to estimate how it’s distributed. One important source of information has been the Federal Reserve’s Survey of Consumer Finances. Another are estate tax records, which Saez had previously analyzed with Columbia University’s Wojciech Kopczuk. A third were magazine rankings of billionaires, such as the Forbes 400, believe it or not. But each of those resources had its flaws. Despite their heroic efforts to oversample affluent households, surveys like the Fed’s tend to miss many of the ultra-wealthy. Meanwhile, for methodological reasons, the fact that life spans seem to be increasing faster for the rich than for other Americans may distort the results obtained by examining estate taxes. And as for magazine rankings, well, they’re produced by journalists. Let’s be real.
Saez and Zucman have turned to another strategy, called the “capitalization method,” that attempts to correct for the shortfalls of those more established approaches. It relies on the fact that while the U.S. doesn’t tax wealth directly, we do tax the income it creates from interest payments, dividends, and such. By estimating a realistic rate of return for different types of assets, the two economists work backward from the tax data to try and create a picture of American wealth distribution, using additional sources of information, like the Fed survey’s property tax information, to account for assets that don’t necessarily produce taxable income, such as homes. What they find is that all the gains are happening at the top. The higher you go on the pyramid, the better families have fared.
“Income inequality,” Zucman and Saez write, “has a snowballing effect on the wealth distribution: top incomes are being saved at high rates, pushing wealth concentration up; in turn, rising wealth inequality leads to rising capital income concentration, which contributes to further increasing top income and wealth shares.”
Not everybody is sold on Saez and Zucman’s approach. Saez’s old collaborator Kopczuk, for instance, recently released a thoughtful paper criticizing their work at length. Of his many points, one has stuck out to me in particular: If the rich get higher returns on their investment portfolios than typical Americans, the capitalization method could end up overestimating how much wealth they start with. It struck me as a particularly powerful point, in part, because Piketty spends a significant section of Capital in the Twenty-First Century suggesting that the wealthy may indeed get better returns on their capital than ordinary investors, in part because they have access to superior investment managers and certain kinds of high-yield assets. (For what it’s worth, his findings on that front aren’t anywhere near conclusive.) The Saez-Zucman approach may also have trouble dealing with some capital gains and may attribute income that top financiers like hedge-fund managers really earn through their labor to returns on wealth, because of its tax treatment under the carried interest rule. Point being, there’s still lots to argue about. Zucman and Saez also admit that their work can still be refined.
With all that said, Piketty has pointed to their results as his preferred data series on American wealth distribution. When I recently spoke with Tyler Cowen for my look back on Capital, he told me that the Saez and Zucman approach was already having a “significant impact” among other economists, more so than Piketty’s famous framework r>g. There’s no question about whether it’s being taken seriously.
And if their work does hold up to further criticism, here’s why it’s important: Despite all of the government’s attempts to redistribute income through taxes and transfers, the rich still seem to be stockpiling wealth faster than the rest of us. That’s a recipe for a future dominated by heirs who are born into their money, along with all the opportunities and political power that come right along with it.