Uber has many Uberisms, but “small business” is one of its favorites. Both the company and its executives are fond of talking about their platform as a job- and opportunity-generating machine. Drivers who work for Uber are not just independent contractors, but rather “small business entreprenuers” proving that driving for Uber can be “sustainable and profitable.”
Uber’s efforts to sell this story to drivers and riders alike has at times left something to be desired. In late October, I wrote about Uber’s “unicorn,” the supposedly median New York City driver earning the equivalent of $90,766 a year—which Uber could not produce a single example of. Shortly after that piece ran, I met with Josh Mohrer, Uber’s general manager for New York City, at the company’s local headquarters in Long Island City to talk more about the reality of what Uber’s drivers actually make. As things stand, it’s tough to know whether Uber’s estimated 10,000 drivers in the city are mostly full-time (40 hours or more, by the company’s standard), mostly part-time, or a fairly even mix of the two—and how the number of hours a driver chooses to work affects the typical hourly earnings he or she sees.
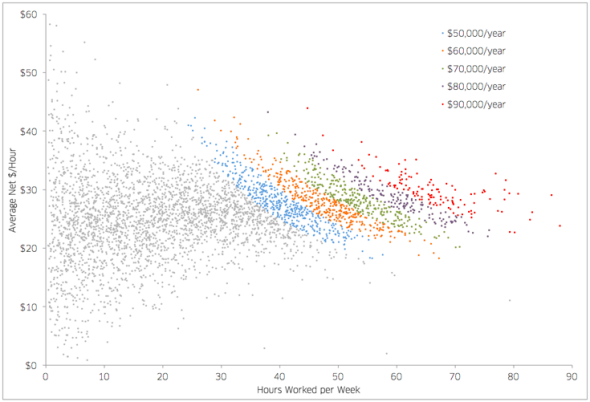
Today, Uber agreed to release a bit more of that information in a post on its blog. Using a sample of “several thousand” drivers in New York City from the week of Nov. 3, Uber compiled two scatterplots. The first shows how average net earnings per hour varies based on the number of hours drivers choose to work. The second contains the same data but is color-coded to show the annualized amount drivers are making based on where they fall for hours worked and average net earnings. Net earnings are calculated as after uniform expenses—Uber’s fee, sales tax, and New York’s black car fund—but before costs that can vary for each driver, such as gas, insurance, car cleanings, maintenance, and vehicle depreciation.
Courtesy of Uber
Uber declined to release a spreadsheet of the data behind these charts or to say exactly how many drivers were examined to make them. A spokeswoman would only say that the sample is “statistically significant” and that the data “must be anonymized and compiled in a scatterplot” because of Uber’s privacy policy.
Assuming that the sample is, in fact, statistically significant, these charts offer a key insight: The more hours you work for Uber, the more reliable your hourly average becomes. Look at the first scatterplot again. As the number of hours worked per week moves past 50 or 60, drivers start to reliably earn somewhere between $20 and $35 an hour. But for those working part time, and especially less than 30 hours, it’s a crapshoot. Some are averaging $25 net per hour. Others are averaging upward of $40 or even $50 while others are barely scraping $15.
In many ways, this makes perfect sense. Drivers working for Uber part time can be strategic about their hours. One person who works 10 or 20 hours a week might only go out during the busiest times, when surge pricing kicks in. Then again, another driver who works a similar number of hours each week might fit them in when it’s most convenient—and not necessarily most lucrative. Either way, their net average hourly earnings will vary greatly based on what hours they choose to work.
Full-time drivers are completely different. The more hours they work, the less choice they have about what those hours will be. There are only 168 possible hours to work in a week. Drivers working 50, 60, 70, even 80 hours a week are much more likely than part-time drivers to be drawing from the same overall set of work hours, and so the range of their average net earnings is much smaller, and the averages themselves a better representation of what can be reliably earned on Uber’s platform.
Now go back to the second scatterplot. Based on the image alone—again, Uber declined to provide a spreadsheet of the data—it seems clear that $90,766 is not a median in any sense. In an effort to stick to its initial claims, Uber has recently emphasized a new detail: that $90,766 was in May the median earned by full-time drivers in New York. Since then, as Mohrer has told BuzzFeed, “the whole makeup of our supply base has changed a lot and a lot of part-timers have come in” to a point that $90,000 is still possible, but no longer the middle even of the full-time pack. (It’s worth pointing out that this is a bit of a logical fallacy on Uber’s part. The company has always said $90,766 was a median of drivers working at least 40 hours a week. A sudden influx of part-time drivers shouldn’t affect statistics of the full-time set.)
When I met with Mohrer at the end of October, I asked him flat out if he believed that $90,766 was still at that time the median for full-time drivers in New York City. “Yeah,” he told me. “I could find you 500 guys.” We corresponded for a few weeks after that and Mohrer repeatedly told me he was “working on” finding a handful of those drivers, but in the end never sent along any names.
At any rate, what matters here is that the median of this data—any median, really—doesn’t seem all that useful. Neither do the average net earnings per hour for part-time drivers. In its blog post, Uber notes that “the average that partners earn per hour stays relatively constant no matter how many hours they’re online per week.” But that’s not really true. The trend line they’ve appended to their scatterplot isn’t showing the average earnings per hour—it’s tracing the best fit line through all the data of all the averages from what thousands of drivers made per hour in one week. That’s valuable at the full-time end. But for the part-time drivers who make up most of Uber’s platform, the numbers are all over the place. And if you draw a straight line through a ton of really random-looking data, it doesn’t mean anything.