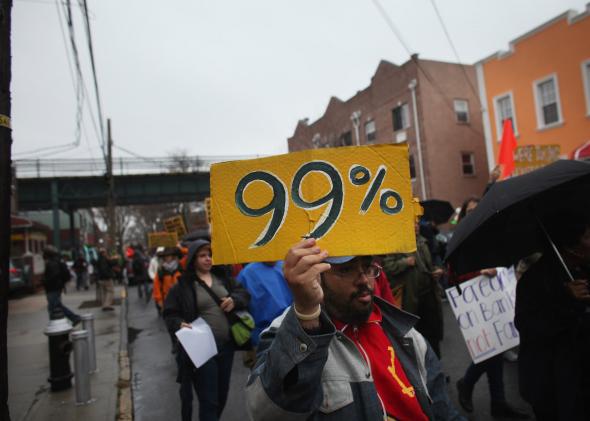
If Emmanuel Saez and Gabriel Zucman are correct, U.S. wealth inequality has been surging faster than economists ever thought. As I wrote last week, the duo recently unveiled new research suggesting that the richest one-thousandth of all American households now claim roughly one-fifth of the country’s collective net worth, about double their share in the 1980s.
But here’s the kicker to their findings: While the super-rich are growing their piece of the pie, just about everybody else’s portion is shrinking.
That may sound intuitive, but it’s not. When it comes to income—what Americans earn—the entire top 10 percent of households, who in 2012 earned at least $113,000 per year, have seen their share rise. However, when it comes to wealth—what Americans own—everybody outside of the top 1 percent has been backsliding.
To put it another way, when measured by income, the workaday rich (who some might call the upper-middle class) have been among the winners. When measured by wealth, they’ve been among the losers.
I’ve charted out that development below, using a spreadsheet of data Saez and Zucman sent me after my last post. Notice that the entire bottom 99.5 percent of households has given up ground since the 1970s. The share belonging to the bottom 99 percent, meanwhile, has continued diminishing since the 1980s.
Here’s another illustration, before-and-after style. In 1984, the bottom 99 percent saw its share of wealth peak at a bit above 75 percent. By 2012, it was down to about 60 percent. Both the bottom 90 percent and the 90th to 99th percentile got crunched.
That’s not how we used to picture the recent evolution of wealth inequality. New York University’s Edward Wolff had previously found that since the 1990s, households in the 90th to 99th percentile grew their share of the country’s net worth considerably. But Wolff’s research relied on government surveys, which often miss the ultra-wealthy and thus might understate the size of the wealth gap. Saez and Zucman work backwards from tax records, which gives them a more complete picture but requires a bit more inference in their methodology. At this point, their findings are still preliminary and could change a bit with time.
So far, we’ve only talked about relative comparisons. But Saez and Zucman’s work also suggests that the bottom 99 percent may be poorer in absolute terms than they were before the housing bust. Adjusted for inflation, Americans have only just recovered the per-household wealth they lost in the economic meltdown. At the same time, wealth inequality continued increasing at least through 2012, the last year Zucman and Saez have available.
So there’s the same amount of wealth to go around, but more is being passed to the top. The rich really have gotten richer. Everyone else really has gotten poorer.
