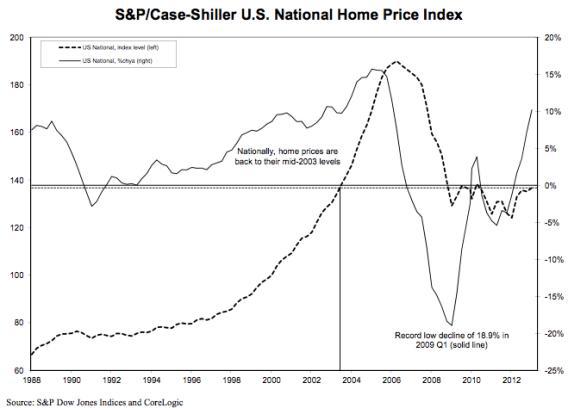
The new Case-Shiller house price index with data through March 2013 is out today (PDF) and the news is that home prices soared 10.2 percent year-over-year. It’s important to remember that even though this is coming out in late May, it’s information about stuff that was happening in January, February, and March.
The chart above, which indicates the level of house prices as well as the percentage change, shows that we’ve rebounded to mid-2003 housing prices. It also illustrates how problematic the idea of “calling” a bubble is. I know plenty of people who “called” the bubble in 2004, then looked silly for a couple of years, then looked super-smart as prices crashed for a few years, but who now look … I dunno. Prices have fallen only very slightly since that time and they’re back on the rise. It could be that this is a bull trap and there’ll be a whole secondary housing price collapse that brings us back down to 1990s levels. Or prices could rise a bit more and stabilize at 2004 levels. Financial markets are simply very hard to predict. Relative to rents, houses still look cheap in most markets, and that situation seems unlikely to persist. But whether that means rents will fall or housing prices will rise is very difficult to know.