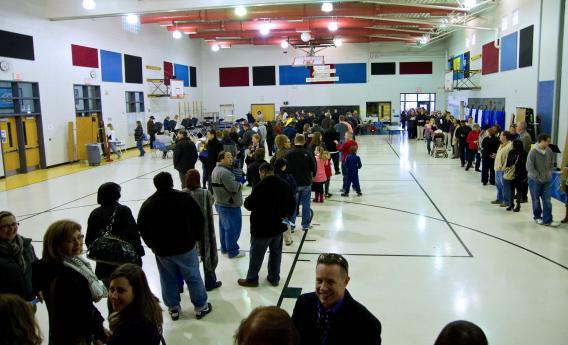
Most voters in Florida waited around an hour and a half at the polls, according to data pulled from Twitter late this afternoon.
Voters in the District of Columbia, South Carolina, Massachusetts, New York, Louisiana, and Michigan all faced waits of up to an hour or more. The data were compiled by polling the Twitter Search API for status updates posted today with keywords like “stood in line,” “waited,” and “took me,” and that also contained the words “to vote” and a time interval.
While voters in non-swing states in the Northeast can be certain their ballots will not affect the presidential race, they appear to be braving the cold in droves to vote anyway.
Here are the results as of 5 p.m. Eastern:
Swing States
Florida: 90 minutes (sample size: 320)
Virginia: 48 minutes (sample size: 218)
Pennsylvania: 45 minutes (sample size: 102)
Ohio: 40 minutes (sample size: 121)
North Carolina: 15 minutes (sample size: 81)
Wisconsin: 15 minutes (sample size: 45)
Non-Swing States
District of Columbia: 90 minutes (sample size 172)
South Carolina: 90 minutes (sample size 127)
Massachusetts: 90 minutes (sample size 65)
New York: 78 minutes (sample size 294)
Louisiana: 65 minutes (sample size 45)
Michigan: 55 minutes (sample size 134)
Indiana: 50 minutes (sample size 95)
Maryland: 45 minutes (sample size 75)
Illinois: 40 minutes (sample size 75)
Minnesota: 30 minutes (sample size 50)
Missouri: 30 minutes (sample size 81)
California: 24 minutes (sample size 122)
Tennessee: 20. minutes (sample size 48)
Texas: 20 minutes (sample size 119)
Georgia: 10 minutes (sample size 173)
Methodology
Results were separated by state with users’ locations as returned by the Twitter API, filtered through the Google Geocoding API in order to normalize the state names. (Caveat: While the API’s results are reliable, they are not perfect; we account for this below.) Search terms also excluded links and retweets to ensure that updates “belonged” to the user posting them.
Out of 6,800 updates, about 45 percent had usable wait time information and were from users clearly located in U.S. states. In order to avoid skewing the data, wait times longer than 18 hours that might be caused by erratic data or parsing bugs were discarded, and medians were taken for each state, rather than the arithmetic mean. The larger the sample size, the less any erratic data will affect the results; however, to ensure a base-line level of accuracy, states with fewer than 45 samples were not included, and data were monitored to ensure overall accuracy of location data. All states’ data have at least a confidence level of 95 percent with a confidence interval of 15, while that of Florida, the largest sample, has a confidence interval of slightly below 5.
