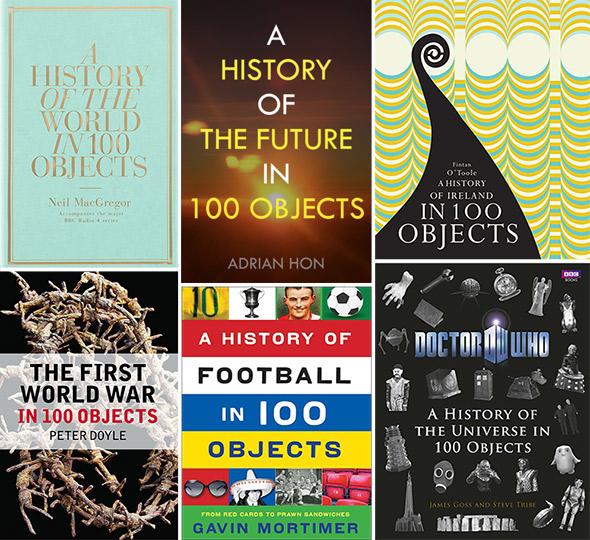
Slate editor David Plotz made a surprising discovery in a London bookstore over the weekend: Three different books, all from different authors and different publishers, all using the same title and conceit.
And not only are they all from 2014, but the Hughes-Wilson and Sheffield books came out the same week. (Doyle’s book is due to arrive a bit late to the party in September.)
Why are we suddenly inundated with so many histories in 100 objects? The history of this trend can be traced, like so many things, back to one cultural object. In 2010, the BBC and the British Museum rolled out their radio series and accompanying book, A History of the World in 100 Objects. The popularity of that series (endorsed not once but three times on Slate’s Culture Gabfest) and the irresistibility of the concept was such that soon everything was getting its own HIAHO (history in a hundred objects).
The concept has been used for countries:
It’s been used for cities:
And even counties and small towns:
It’s been used for sports:
And hobbies:
And bands:
While Americans have tried to outdo their British counterparts:
It’s been used for fictional worlds:
And even to tell us the history … of the future:
Not to be left behind, Neil MacGregor has come out with a sequel to his original series:
Though the master himself may have been outdone:
Indeed, some of the books are a little more stingy with their objects:
The trend is still going strongest in England, but it seems to be travelling rapidly across the pond. Last year we got The Civil War in 50 Objects, and A History of New York in 101 Objects is on its way. Even the U.S. Naval Academy is working on a “100 Objects” series. We could be on the eve of a HIAHO British Invasion.
The only thing left is for publishers to tell us what the “100 Objects” meme can teach us about the struggle for the soul of history. And then maybe a journalist could sum it up—in one chart?
