Damn you, Nutmeg State! Curse you, Land of Steady Habits!
Why rage against Connecticut? Well, many Americans will need no reason. But every Massachusetts native has a great one this week. See, Connecticut has eked out a narrow victory over the cradle of the American Revolution in this fascinating report on overall well-being. The 2013-14 report, released yesterday by Measure of America, under the auspices of the Social Science Research Council, slices and dices America’s performance not just on income, but on various metrics of health and education as well.
The rankings are based on the American Human Development Index, “an alternative to GDP” that aims to summarize not just how rich Americans are, but how we’re doing on the things that we presumably want riches for: a long and healthy life in which everyone can make the most of their talents and interests. The American index is derived from the U.N.’s Human Development Index (on which, by the way, the U.S. currently ranks third in the world, after Norway and Australia).
I first became familiar with the American version of the index (and the haunting inequalities it reveals) while examining why Massachusetts is pretty much the best model we have for the healthy, wealthy, well-educated future most Americans want.
This week’s new report, in addition to announcing Connecticut’s squeaker of a triumph over Massachusetts, offers plenty more food for thought for all Americans:
* In terms of the overall index—a measure of how well states are “improving people’s well-being and expanding their freedoms and opportunities”—Connecticut and Massachusetts are followed by New Jersey, Washington, D.C., and Maryland.
* The bottom five states are Alabama, Kentucky, West Virginia, Arkansas, and Mississippi.
* The lowest-performing metropolitan areas are Detroit, Houston, Tampa, San Antonio, and Riverside-San Bernardino.
* The top five metropolitan areas are Washington, D.C., San Francisco, Boston (take that, Hartford!), Minneapolis-St. Paul, and New York.
* The only state that achieved a 2010 score below its 2000 score? Michigan.
The index also breaks down overall well-being by racial group. The disparities revealed by the index are nothing short of a national disgrace:
* Native Americans (3.55) come out less than one-half as well as Asian-Americans (7.21). In between are African-Americans (3.81), Latinos (4.05), the nation as a whole (5.03), and whites (5.43).
* There’s not a single state where Latinos or blacks fare better, by these measures, than whites or Asian-Americans.
These results are jarring (and there’s plenty more in the full report). But the implications aren’t quite as clear. The easiest and most rhetorically powerful criticism of the state rankings, for example, is to note that Connecticut, Massachusetts, New Jersey, etc., are rich states, so it’s not surprising they do well on health and education, too. To put it another way: Why don’t we just focus on creating wealth, and let health and education outcomes follow the money, as they clearly seem to do?
I put this to Kristen Lewis, co-director of Measure of America. In response, she questioned, essentially, which came first in rich northeastern states: the wealth, or the investments in health and education?
The states that perform the best on the index—like Connecticut, Massachusetts, and New Jersey, the top three—invest more in education and have higher levels of educational attainment than other states. Education explains 83 percent of the state-level variation in the index.
In untangling this chicken-and-egg question, of course, what would really help are examples of states that do well economically, but not socially.
The states with the biggest earnings increases over the last decade—North Dakota, Wyoming, and Montana—are in the bottom half of the overall index ranking list, coming in at 26, 29, and 40, respectively. More money doesn’t necessarily translate into greater well-being for the average American.
Even better, though, would be a pair of states that have similar economic standings but sharply different social outcomes. Or even a pair in which one does better economically, but worse socially. Ms. Lewis suggested Louisiana and Vermont:
State GDP per capita, which measures a state’s total economic activity, is much higher in Louisiana than in Vermont. But residents in the Pelican State are not better off than their Green Mountain State counterparts as a result of the increased economic activity…people in Vermont can expect to live nearly five years longer than people in Louisiana and are less than half as likely to lack a high school diploma.
So wealth doesn’t necessarily lead to longer lives and better education. It’s possible to argue, of course, that Vermont’s social investments are holding the state back economically—that it might be richer if it focused less on education and health. But even if a state was paying some GDP penalty for its social priorities (and Connecticut, Massachusetts, and so on don’t seem to be), that only clarifies the question that the Measure of America report hopes to raise: Why focus so exclusively on GDP growth, instead of a mixed measure of wealth and improved human outcomes?
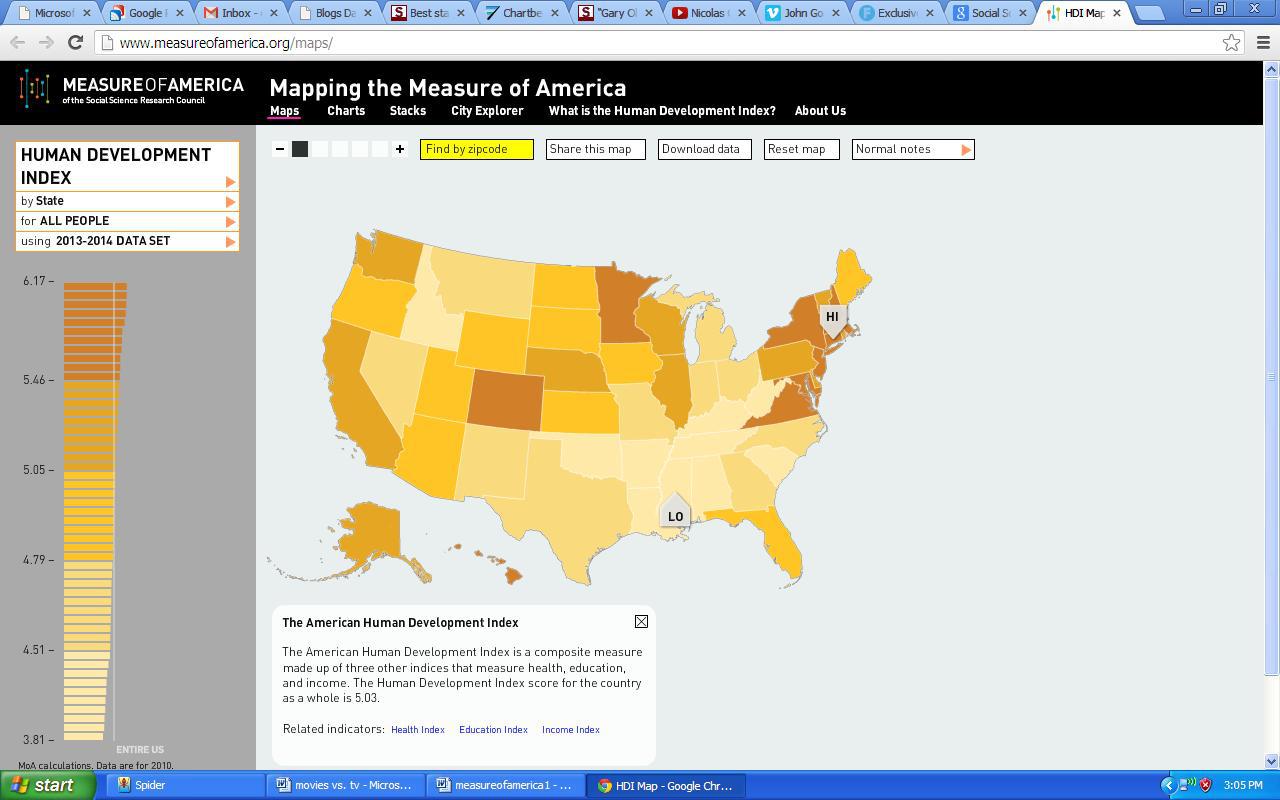
On the plane or train to Connecticut, take the time to browse the full report. And for a more literal picture of the state(s) of American well-being, don’t miss the interactive maps.