Recently, an image charting the distribution of genres across all films distributed between 1908 and 2008 went viral after being posted on Reddit. With a credit citing the now-defunct London Times Labs Blog as the source of the information, the colorful graph raised a number of interesting questions, starting with a very basic one: Where did this data come from?
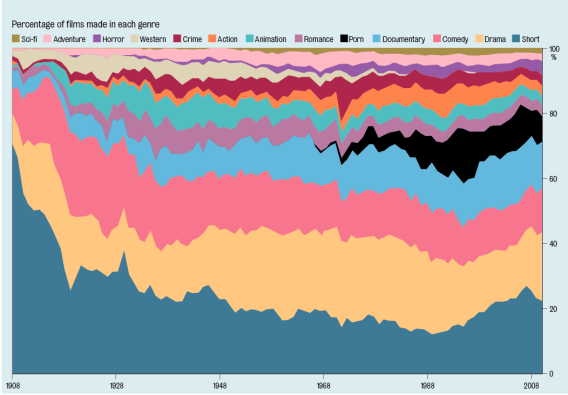
A graph of film genre trends created by Richard Burgess and Jonathan Richards
London Times Labs Blog. Note: Slate has asked the London Times for permission to post this graph, but has been unable to reach the image’s owners.
The graph making the rounds did not feature any supporting text, but an archived version led me to its creators, Julian Burgess and Jonathan Richards, both now working at The Guardian. Burgess told me that the graphic was created with data downloaded from IMDb. Burgess wrote a script that took the year and genre of each film listed on the site; the results were tallied for the graph.
Why are “shorts” listed as a genre on the graph? Because of IMDb’s classifications. Burgess posits that one reason the site would classify this category as a “genre” is that the quality and accuracy of IMDb’s information decreases when you go further back in time. In 1908, when the graph begins, the majority of films were shorts, and many are not classified within specific genres.
Something similar happens with porn, which IMDb classifies as “adult,” and which doesn’t appear on the graph until the 1960s. As Barry Grant, a film scholar who specializes in genre studies, explained to me, porn goes back to the beginning of cinema. But IMDb only lists three “adult” films prior to 1960: The Goat (1914), Aunt Martha Visits Sadie (1934), and Hot Chicks (1948).
Grant also pointed out that “drama” may be too broad a term—the data ignores, for instance, melodrama, a more specific genre that has been a key category in movie history. The original IMDb list that Richards and Burgess used has more than 25 categories— “sport,” “family,” “history,” and so on—but some of the films were merged to fit under certain genres for the final graph, Burgess recalls. Ditto for films tagged by IMDb under multiple genres. (Funny Girl is listed under musical, romance, comedy, drama, and biography, for example.)
So can we learn anything from this graph? Grant says that sci-fi’s rise in the 1950s and ’60s and the decline of the Western shown here both match actual film history. Crime has been a fairly steady source of movie stories since at least the 1930s. Action movies appear to have surpassed adventure movies in the 1970s, around the time of major new developments in special effects. But to really be sure of those trends, we still need to look to film scholars. Burgess and Richards intended the graph as a quick and dirty look at genres over time, not as a definitive account. But even if their chart can’t answer all our questions about film genre history, it does a pretty good job raising some of the more interesting ones.