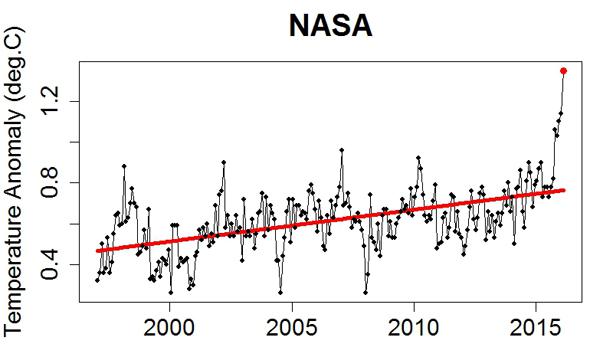
As I mentioned on Monday, February’s global temperatures blew the previous monthly high temperature record out of the sky. It was the hottest February on record going back 130+ years.
Over at Tamino’s blog Open Mind, he posted a simple graph that I really like. Climate science deniers are very fond of showing extremely deceptive temperature graphs: They plot the data starting in 1998, when temperatures were higher than average, so it looks like the world hasn’t gotten much warmer since then, and talk about the global warming “pause.” Using the numbers this way is basically a lie; it’s not at all an honest representation of the trend.
Tamino took the temperatures since 1997 and plotted them, and also placed over them a line representing the statistical trend:

NASA/GISS/Tamino
Huh. Look at that. So I ask you: What “pause”?