I’ve been holding off writing about this until it was official, and now it is: the area of the arctic covered by sea ice has reached a record low.
[Click to embiggen.]
“Sea ice extent” is (more or less) a measure of the amount of ice covering the sea surface. It’s measured using satellite data; the area is divided into many bins, and sea ice extent is calculated by adding up all the bins with more than 15% ice in them. Every year the ice starts to grow in the autumn and melts in the summer, so you get a sine-wave curve of extent every year.
Satellite observations began in 1979. In the graph above, the dark line is the average summer extent for the period 1979 - 2000. The gray area around it is the measurement uncertainty (2σ if you want to be exact). The dashed green line is the extent for 2007 - the previous record low year - and the blue line is 2012. I added the red line so you can compare 2007 to now. The data numbers show the record is broken, though on the graph they look tied. [UPDATE: The new plot made by the NSIDC for August 26 clearly shows the extent is now lower than the lowest point in 2007.]
As you can see, we’re still on the way down, weeks ahead of the date of the lowest extent in 2007. The minimum extent in 2007 was reached on September 16. In 2011 - which had the second-lowest extent on record, essentially equaling that of 2007 - lowest extent happened on September 9. This year it was August 25.
Notice any trend there? I don’t want to make too much of the idea that it’s happening earlier every year because there aren’t enough data points, but it’s consistent with the Earth’s temperature increasing. The massive heat wave that melted so much ice in Greenland this summer may have something to do with this as well.
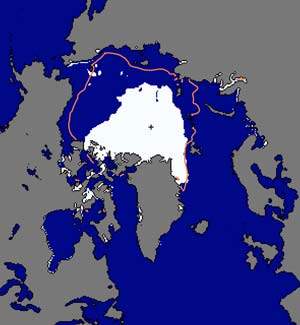
 Here’s a map from the National Snow and Ice Data Center showing the extent for August 25, 2012. The orange line is again the average for August 25 taken over the years 1979 - 2000. White shows ice, blue is ocean, gray is land; you can see Greenland directly below the ice, with Canada and the US to the lower left. Obviously, the sea ice extent for August 25 is way, way below average compared to the past.
I’ll be honest: this map and graph are making me unhappy. The fantastic website Skeptical Science has more about this. The most worrisome aspect of this to me is how this accelerates. Ice is bright white, so it reflects sunlight. Sea water is much darker and absorbs that light. So the more ice you lose, the darker overall the arctic gets, and the faster it melts.
Of course; we’ll hear the usual excuses and cherry-picking from the denier set, but here are the facts:
The Earth is warming up. The rate of warming has increased in the past century or so. This corresponds to the time of the Industrial Revolution, when we started dumping greenhouse gases into the atmosphere. Greenhouse gases warm the planet (hence the name) – if they didn’t we’d have an average temperature below the freezing point of water. Carbon dioxide is a greenhouse gas which is dumped into the atmosphere by humans to the tune of 30 billion tons per year, 100 times the amount from volcanoes. And finally, approximately 97% of climatologists who actually study climate agree that global warming is real, and caused by humans.
Far from being a fluctuation, these records getting broken are more likely a trend, and it’s more likely we’ll see more of them.
Graph and image credit: National Snow and Ice Data Center
Related Posts:
- Arctic ice at second-lowest extent since 1979
- Sea ice, coming and going
- As arctic ice shrinks, so does a denier claim
- Our ice is disappearing