There’s a new poll aggregator in town. And it’s a monster, harnessing three of the most powerful ideas in science today: Bayesian inference, open-source software, and reproducible research.
For the past few election cycles, it’s become generally understood that single surveys can be noisy and that averaging across polls gives a better sense of trends in public opinion. But how do you do your averaging? Our current election forecasts and poll aggregators fall in one of two camps: either transparent and simple (for example, the moving averages of RealClearPolitics) or complicated with proprietary “special sauce” (for example, whatever Nate Silver is currently doing).*
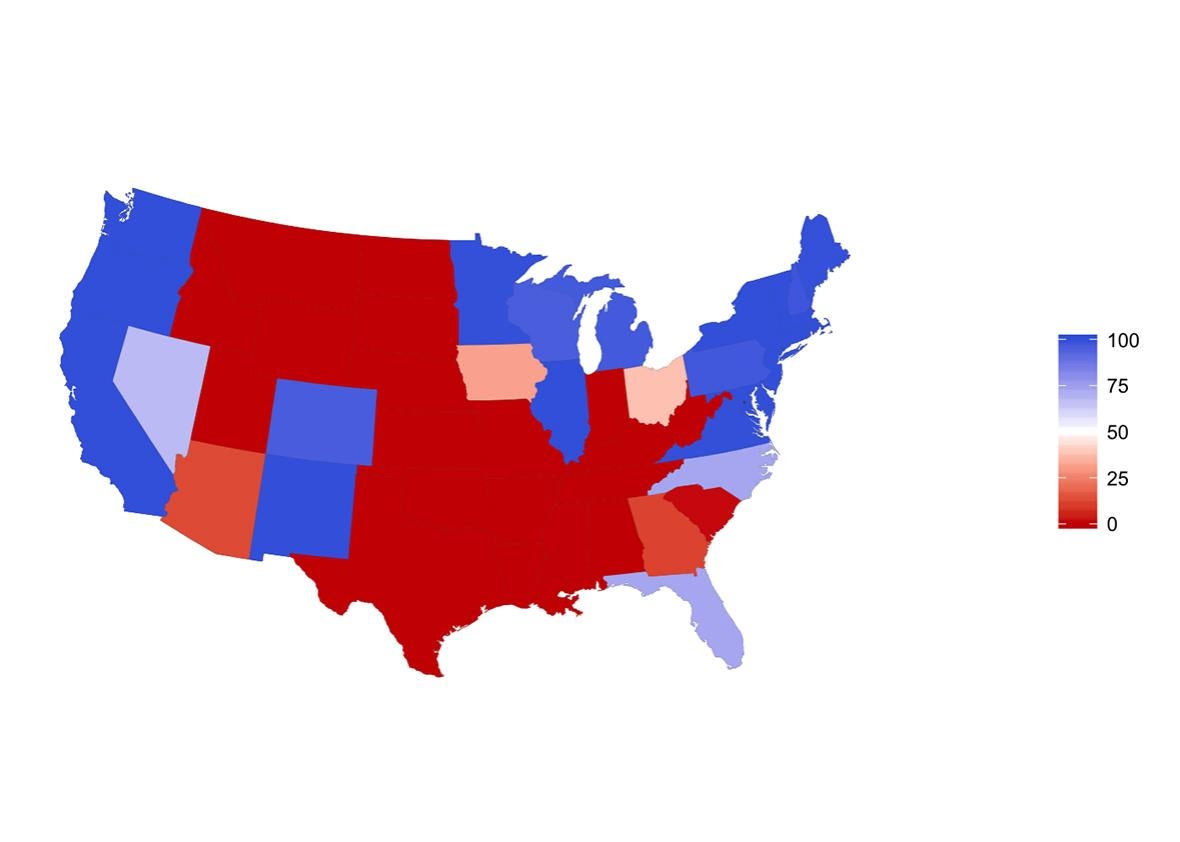
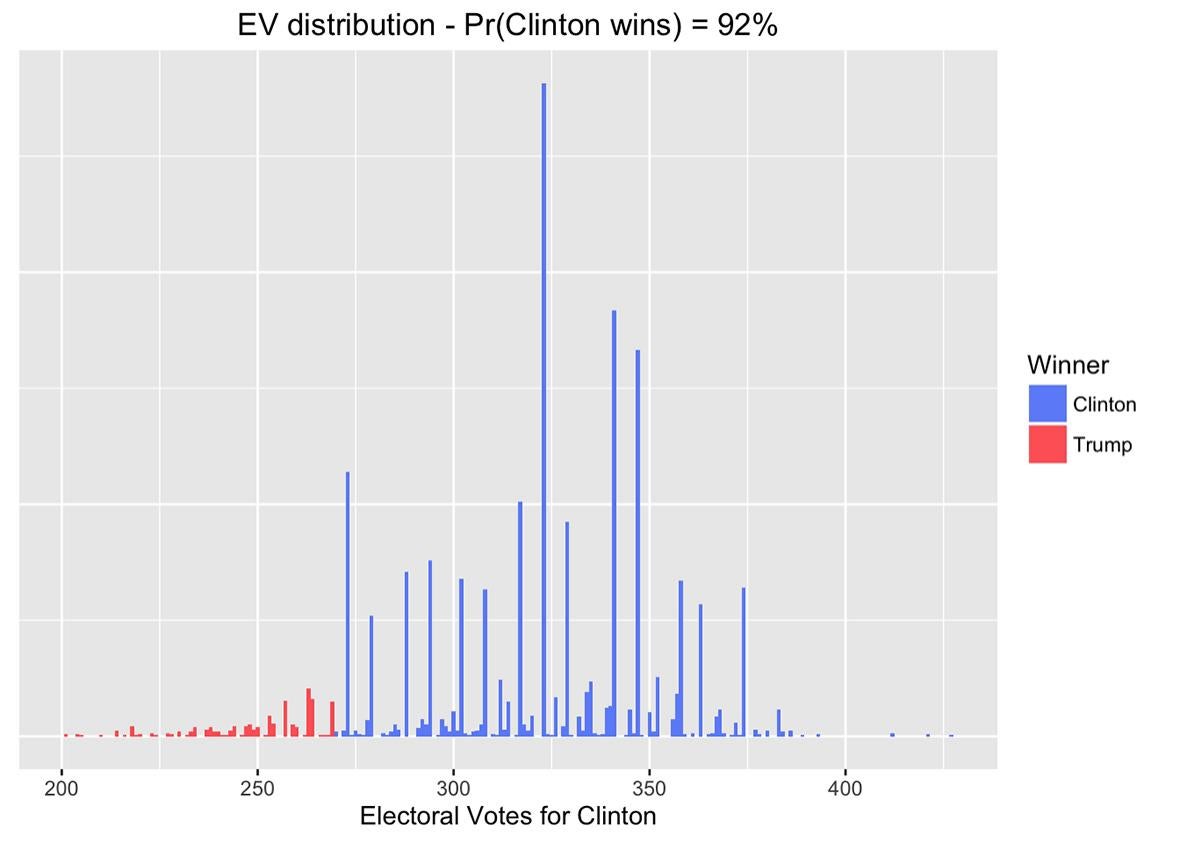
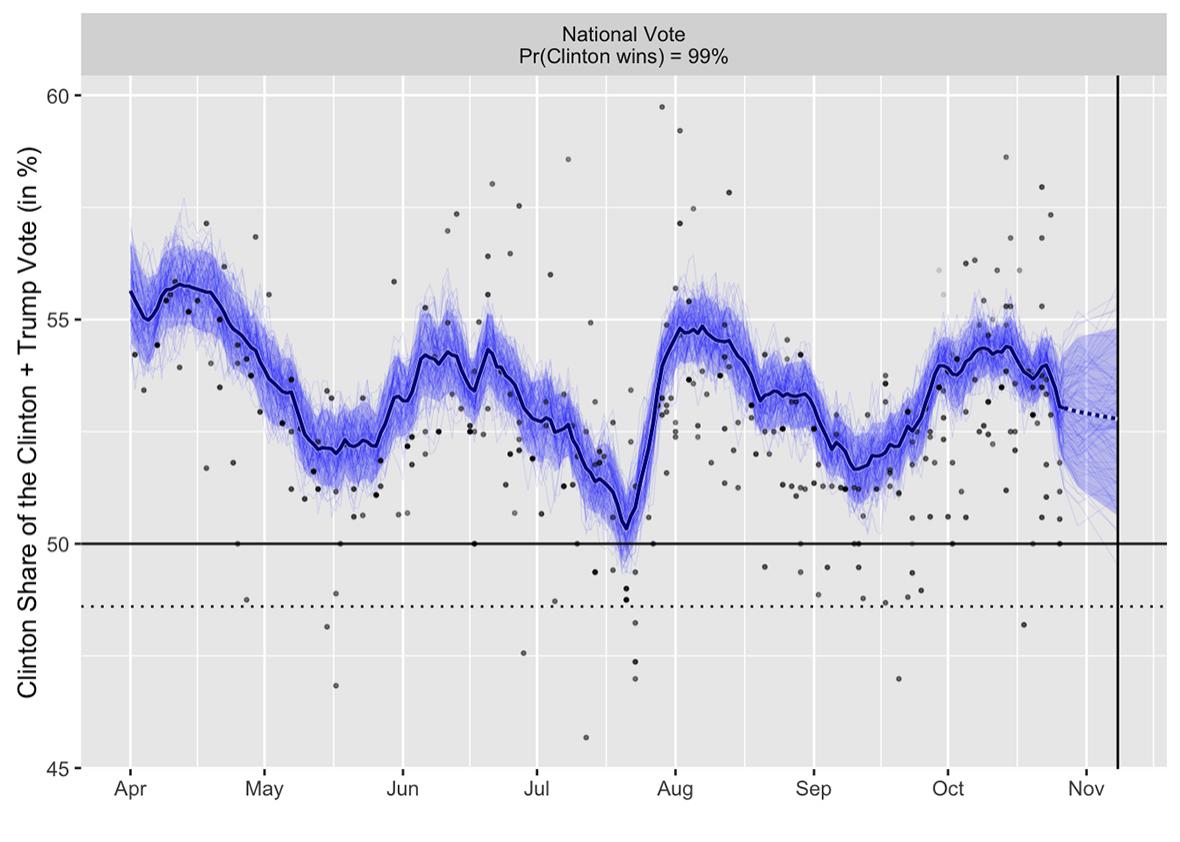
But the model I’m talking about here is the best of both worlds. It includes state and national poll data, models of correlations between states, a pre-election forecast, state-level and electoral college forecasts, and pretty graphics—but all in an open-source framework, so anyone can check any part of the data or model. This incorporates the “special sauce” types of influence, such as time-series model and pollster effects. All these aspects of the model are also checkable: Any technically minded outsider can see not just which pollsters are estimated to be biased toward one side or another, but also can take apart the model and see which data are causing these estimates to be what they are. There’s lots of concern about media bias from all directions, and open source is the best way to address skepticism about particular assessments.
Rawgit
The model combines state and national poll data with a pre-election forecast based on past election data. It is called “dynamic” because it updates as new poll data comes in. It comes from Pierre-Antoine Kremp, a French sociologist who adapted a dynamic forecasting model constructed by political scientist Drew Linzer. Kremp tweaked Linzer’s model to allow pollster effects, programmed it in open-source programming languages, and put it on a webpage with a succinct description, clear graphics, and links to all the source code.
The model runs in R and Stan—R is a general program for statistical data manipulation and graphics; Stan is a specialized program that performs Bayesian inference, which is an approach, based on probability theory, for combining information from multiple sources. (Disclosure: I am one of the developers of Stan.)
There are several beautiful things about the open-source nature of this forecasting website. First, the analysis is fully reproducible: Anyone can run Kremp’s script, grab the same data that Kremp is using, and then run the R and Stan analyses to produce the estimates and graphs on the webpage.
Second, the result itself is inherently collaborative. Instead of being anyone’s personal model, it’s Pierre-Antoine Kremp’s implementation of Drew Linzer’s model, which itself is based on much earlier work in the statistics and political science literature. And if someone wants to critique the analysis, change the model, or add or remove data, he or she can directly do so. Anyone who has a problem with it can open up the model, copy it onto her own computer, make whatever changes she wants, and then post her own version of the model, her own forecasts, and her own graphs. There’s no gatekeeper: You can put out your data and assumptions, and anyone can then make judgments from there. Different people might favor different models, and that’s fine. For example, analysts make different choices about adjusting for party identification of survey respondents; to the extent this information is available, it can be incorporated into the model. By anyone.
As Drew Linzer writes, at this point in the election, all sensible aggregation algorithms will give pretty much the same result. What’s special about Kremp’s forecasting program is not so much its specific predictions, but rather its process. And that’s why I think Kremp’s site, or something like it, will ultimately put all the other poll aggregators out of business. The transparency of Kremp’s code allows for easy incorporation of factors such as pollster house effects and state-level correlations and makes plain-vanilla averaging efforts less relevant to the discussion. And, from the other direction, as analyses become increasingly sophisticated, readers and news organizations will rightly put more trust not in secret sauces but in open-source procedures where all data enter in unambiguous ways. In science, reproducible research wins.
Rawgit
This is not to disparage the pioneering work of Nate Silver and others who are operating their own aggregators and forecasts. They’ve taken quantitative election forecasting out of the political science ghetto and made probabilistic thinking part of the general conversation. Open-source forecasting is just the natural next step, bringing the principles of reproducible research to our understanding of elections.
*Correction, Nov. 1, 2016: An earlier version of this article cited Pollster.com as an example of simple aggregation. Pollster.com uses a Bayesian model which it shares upon request. (Return.)