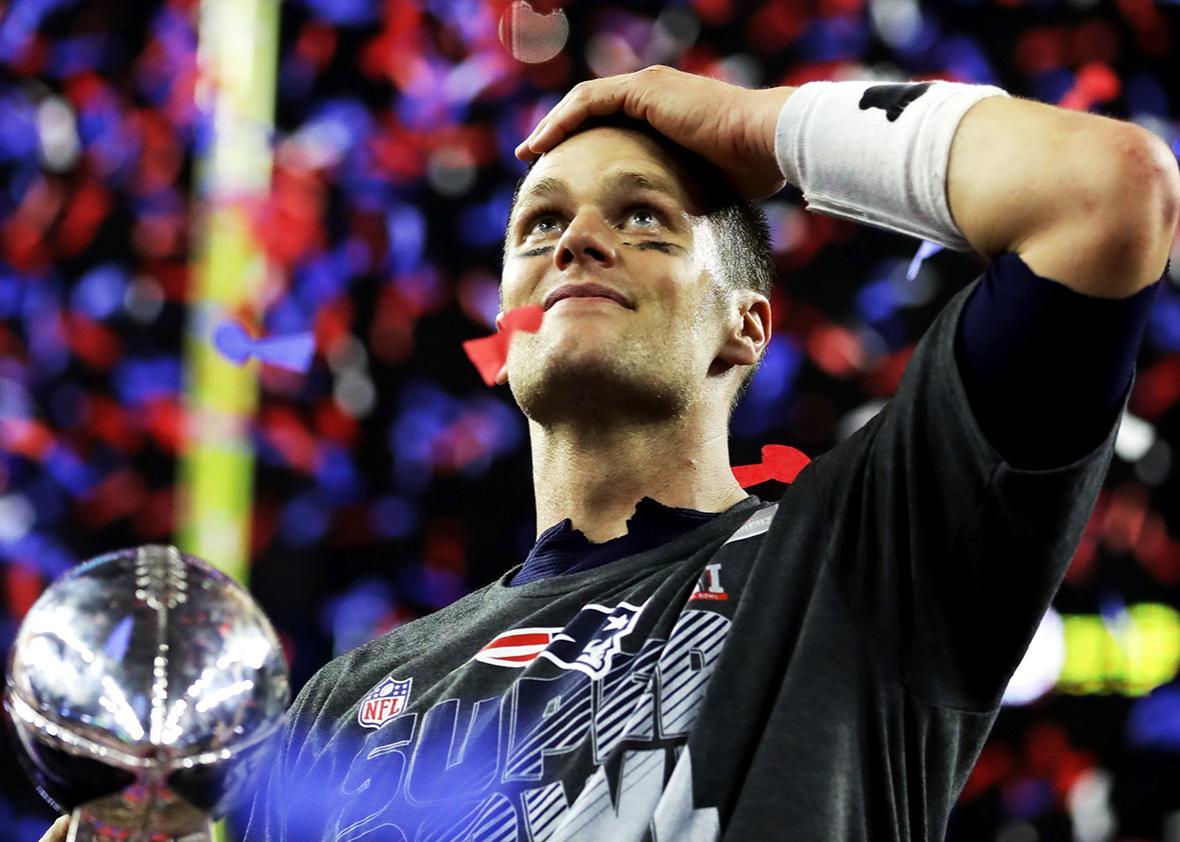
How big was the Patriots’ 25-point comeback against the Falcons? It was by far the biggest ever in a Super Bowl; before Sunday, no team had overcome anything bigger than a 10-point lead. This isn’t just a Super Bowl–based anomaly. In the entire history of the NFL, a team has come back to win just four times after trailing by more than 25 points.
You can see the depths to which the Patriots sunk in this win-probability graph provided by ESPN Stats & Information.
It’s possible to look at that image and think, Wow, ain’t sports grand. We watch all of these games because we can’t know with certainty what’s going to happen. The possibility of witnessing low-probability events helps take my mind off the inevitability of my own death.
It’s also possible to look at that image and think, Those nerds screwed up again. Forget math.
Given that number crunchers got the election and the Super Bowl wrong, the time has come to throw these so-called prognosticators in the ocean and see if they float. But before we do that, I’d like to note that a probability is not a guarantee. The fact that a high-probability event doesn’t end up happening is not evidence that it was really a low-probability event. Or to put it another way, if a model says that something is supposed to happen nearly 100 percent of the time, and it in fact happens 100 percent of the time, you need to tinker with your model.
In this case, it seems weird to mock a calculation that matches our own intuition. We knew in our guts that the Patriots had very little chance to come back from 28-3 down to the Falcons. A win-probability graph attaches a number to that feeling. In the Super Bowl, that number peaked at 99.8 percent—ESPN’s estimated win probability for the Falcons with 6:04 to go in the third quarter.
But while I stand with the probability brigade as a general principle, I do think it’s fair to quibble with these specific probability numbers. In-game win probability, which is now de rigueur on sites like ESPN, is an extremely entertaining tool. It also stands to reason that these sorts of pro-football predictions would be more accurate than, say, presidential political forecasts, given that there have been a lot more pro football games than quadrennial American elections. That doesn’t mean, though, that NFL win-probability numbers are correct down to a decimal place.
Brian Burke, who created ESPN’s win-probability algorithm, confessed on Twitter that his model was “overconfident” in a Falcons victory. Real-time betting in Las Vegas suggested Atlanta had closer to a 96 percent chance of winning, and Burke said he believed the correct probability was “somewhere between” those two numbers.
In 2013, Jason Lisk of the Big Lead found—albeit in a smallish sample of games—that Pro Football Reference’s win-probability calculator also tended to overconfidence. Teams that Pro Football Reference claimed had a 91 to 100 percent chance of victory at the start of the fourth quarter, Lisk determined, won 102 of 111 games when the model predicted they’d win 109.
Why might a win-probability model get things wrong at the extremes? As Burke explained in 2014, his calculations take into account score, time, down, distance, and field position. (At the beginning of the game, it also takes into consideration relative team strength as measured by ESPN’s Football Power Index, but Burke told me that the “FPI factor gradually fades as the game goes on.”) Some scores and times are a lot more common than others. While there have been thousands upon thousands of NFL games, there’s not a huge amount of data on teams coming back from 25-point third-quarter deficits. As Burke pointed on Twitter, teams that were roughly in the Pats’ position had been 0-190 since 2001:
Because these kinds of comebacks are so rare, Burke told me, it’s very difficult for him to benchmark his model with real NFL data. When sample sizes are smaller, we can be a lot less confident about the predictions we derive from those samples. Based on the evidence we do have and our knowledge of how many points a touchdown is worth, we know the Patriots’ victory in Super Bowl LI was extremely unlikely. It feels like faux precision, however, to say the Falcons were a 99.8 percent favorite with six minutes left to play in the third quarter.
In quantitative terms, there’s not a huge difference between a 96 percent chance of victory and a 99.8 percent chance. But the reality is that we think about those two values very differently. The former is pretty much a done deal. The latter feels like an absolute lock. In the big picture, the win-probability graphs had it right. We just need to be sure not to look at them too closely.
