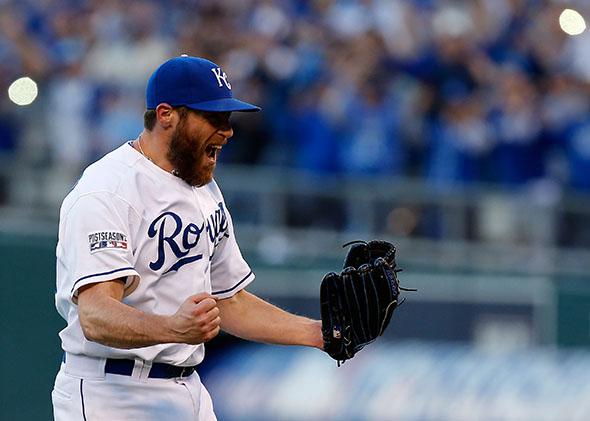
The Kansas City Royals are heading back to the World Series for the first time in 29 years. A big reason for the Royals’ 8–0 record this postseason is the team’s dominant bullpen, which has a 1.80 ERA in 35 appearances. In 1980, when the Royals first reached the World Series, they used relief pitchers just 13 times in nine games. The 2014 Royals used as many relievers in their first two playoff games as the 1980 Royals did in their entire nine-game run.
The rise of relief pitching is not limited to the Royals or the playoffs, and it has coincided with a dramatic shift in how the game is played. Below is a graph that shows the percentage breakdown of runs by inning in the typical major league game in the 1940s, and then from 2004 to 2013. (Data has been normalized to account for unplayed bottoms of the ninth and other anomalies, and does not include extra innings.)
While the rough trajectory has been fairly constant over time—this article by Jacob Peterson of Beyond the Box Score explains why, for instance, teams score more in the first inning—it’s clear that scoring at the end of games has gone down since the 1940s (the furthest back I could find data in Baseball Reference’s Play Index). Here’s a plot showing that decline over time. (The data has again been normalized as described above.)
To pinpoint the cause of this decline with certainty would require a more comprehensive analysis. But the rise of relief pitching seems like the most likely factor.
In 1940 the average starter pitched about seven innings per game. Today, that number is about six innings per game. The number of relievers per game has also increased during this time period, meaning the average length of each relief appearance has declined—a sign that managers are willing to yank pitchers the second things turn south or to gain a platoon advantage. The area plot below is a good illustration of how the role of relief pitchers has changed over time. In 1940 a team used four or more pitchers in about 8 percent of games. Today that’s the case in 61 percent of games.
The charts above show that modern baseball teams allow fewer runs in the late innings, and that modern baseball teams also use more relievers in late-game situations. Correlation does not imply causation, but in this case it seems reasonable to believe that the decline in late-game runs is connected to the rise in relief pitching.
The costs and benefits of relievers can’t be calculated so easily. Relievers generally have lower ERAs than starters, but optimization requires finding the equilibrium where the combined output of starters and relievers is maximized. If a starter pitches more innings and gives up more runs, that will allow the relievers time to rest. That would, in theory, allow a manager to save his best relief pitchers for games in which their teams have the slimmest leads.
Will the role of relievers continue to expand? Even in the last 10 years, it has inched upward. From 2000 to 2004, teams used five or more pitchers in 23.5 percent of games. From 2010 to 2013, that number rose to almost 31 percent of games. In another couple of decades, it seems possible that games in which a team uses just two pitchers will become just as anomalous as complete games are today.
