The title of this post says it all. A 2 percent shift in public opinion is not so large and usually would not be considered shocking. In this case the race was close enough that 2 percent was consequential.
Here’s the background: Four years ago, Mitt Romney received 48 percent of the two-party vote and lost the presidential election. This year, polls showed Donald Trump with about 48 percent of the two-party vote. When the election came around, Trump ended up with nearly 50 percent of the two-party vote—according to the latest count, he lost to Hillary Clinton by only 200,000 votes. Because of the way the votes were distributed in states, Trump won the Electoral College and thus the presidency.
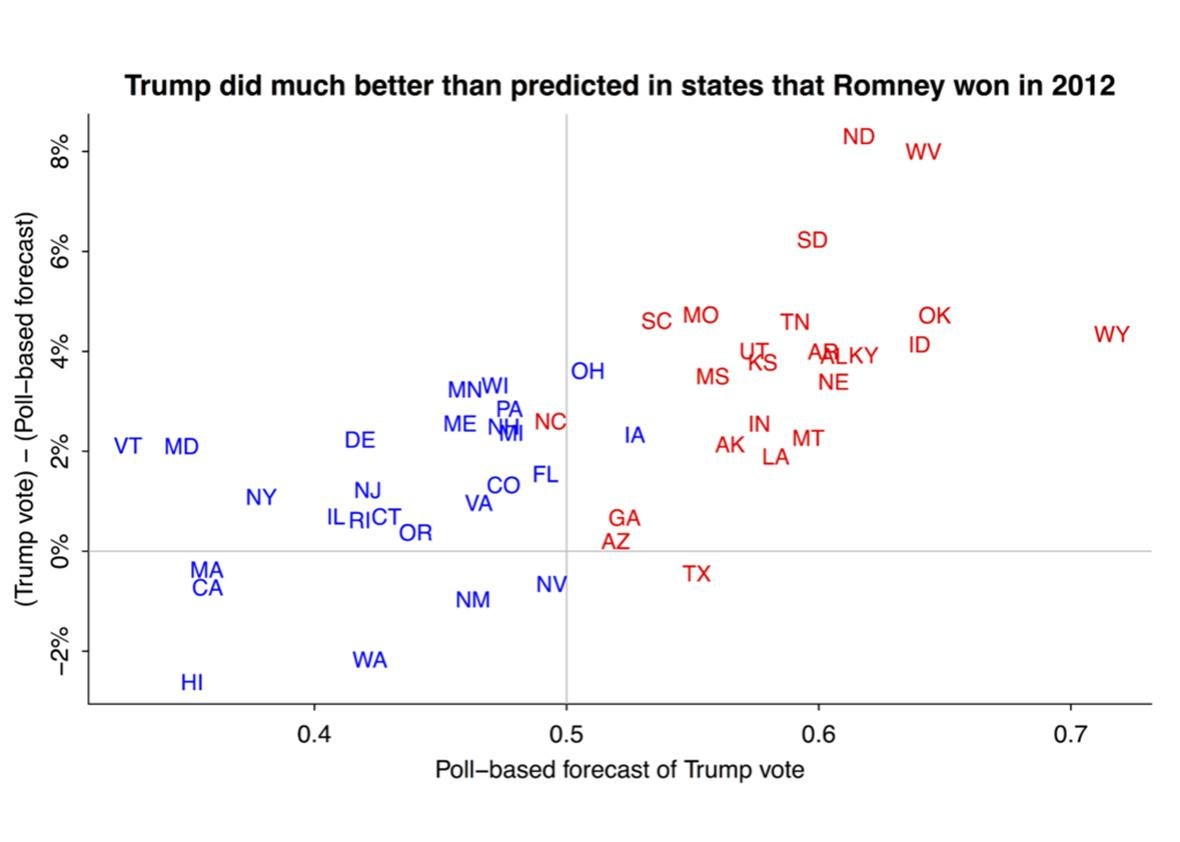
In this earlier post I graphed the Romney-Trump swing by state and also made this plot showing where Trump did better or worse than the polls in 2016:
Andrew Gelman
Trump outperformed the polls in several key swing states and also in lots of states that were already solidly Republican.
Various online poll aggregators were giving pre-election probabilities ranging from 66 percent to 99 percent in favor of Clinton winning. These probabilities were high because Clinton had been leading in the polls for months; the probabilities were not 100 percent because it was recognized that the final polls might be off by quite a bit from the actual election outcome. Small differences in how the polls were averaged corresponded to large apparent differences in win probabilities. Hence sociologist Pierre-Antoine Kremp and I argued that the forecasts that were appearing were not so different as they seemed based on those reported odds.
The final summary is that the polls were off by about 2 percent (or maybe 3 percent, depending on which poll averaging you’re using), which, again, is a real error of moderate size that happened to be highly consequential given the distribution of the votes in the states this year. Also we ignored correlations in some of our data, thus producing illusory precision in our inferences based on polls, early voting results, etc.
Several explanations for what happened have been offered. It’s hard at this point to adjudicate among them, but I’ll share what thoughts I have:
- Differential voter turnout. It says here that voter turnout was up nearly 5 percent from the previous election. Voter turnout could have been particularly high among Trump-supporting demographic and geographic groups. [Update, Nov. 11: Or maybe not! it says here that voter turnout was down this year. Either way, the story would be that turnout was high for Republicans relative to Democrats, compared to Obama’s elections.]
- Last-minute changes in vote. If you believe the exit poll, Trump led roughly 48 percent to Clinton’s 41 percent among the 14 percent of voters who say they decided within 10 days of the election. That corresponds to a bump in Trump’s two-party vote percentage of approximately half a percentage point. That’s something.
- Differential nonresponse. During the campaign we talked about the idea that swings in the polls mostly didn’t correspond to real changes in vote preferences but rather came from changes in nonresponse patterns: When there was good news for Trump, his supporters responded more to polls, and when there was good news for Clinton, her supporters were more likely to respond. But this left the question of where was the zero point.
When we analyzed a Florida poll last month, adjusting for party registration, we gave Trump +1 in the state, while the estimates from the others ranged from Clinton +1 to Clinton +4. That gives you most of the shift right there. This was just one poll so I didn’t take it too seriously at the time, but maybe I should’ve.
- Trump supporters not admitting their support to pollsters. It’s possible, but I’m skeptical of this mattering too much, given that Trump outperformed the polls the most in states such as North Dakota and West Virginia where I assume respondents would’ve had little embarrassment in declaring their support for him, while he did no better than the polls’ predictions in solidly Democratic states. Also, Republican candidates outperformed expectations in the Senate races, which casts doubt on the model in which respondents would not admit they supported Trump; rather, the Senate results are consistent with differential nonresponse or unexpected turnout or opposition to Hillary Clinton.
- Third-party collapse. Final polls had Johnson at 5 percent of the vote. He actually got 3 percent, and it’s a reasonable guess that most of this 2 percent went to Trump.
- People dissuaded from voting because of long lines or various measures making it more difficult to vote. I have no idea how big or small this one is. This must matter a lot more in some states than in others.
I’m sure there are some other things I missed. Let me just emphasize that the goal in this exercise is to understand the different factors that were going on, not to identify one thing or another that could’ve flipped the election outcome. The election was so close that any number of things could’ve swung enough votes for that.
Two other parts of the story:
- Voter enthusiasm. The claim has been made that Trump’s supporters had more enthusiasm for their candidate. They were part of a movement (as with Obama 2008) in a way that was less so for Clinton’s supporters. That enthusiasm could transfer to unexpectedly high voter turnout, with the twist that this would be hard to capture in pre-election surveys if Trump’s supporters were, at the same time, less likely to respond to pollsters.
- The “ground game” and social media. One reason the election outcome came as a surprise is that we kept hearing stories about Hillary Clinton’s professional campaign and big get-out-the-vote operation, as compared to Donald Trump’s campaign that seemed focused on talk show appearances and Twitter. But maybe the Trump’s campaign’s social media efforts were underestimated.
One more thing: I think one reason for the shock is that people are reacting not just to the probability of Trump winning given 48 percent of two-party support in the polls but to the probability of Trump becoming president given our state of knowledge two years ago. I think a lot of the stunned reaction is in part that things got so far.
To use a poker analogy: If you’re drawing to an inside straight on the river, the odds are (typically) against you.* But the real question is how you got to the final table of the World Series of Poker in the first place.
*Correction, Nov. 11, 2016: This piece originally misidentified the poker term inside straight as insight straight.