You sort of know there is a convention bounce that you should sort of ignore, but why? What’s actually in a polling bump? The recent Republican National Convention featured conflict and controversy and one very dark acceptance speech—enlivened by some D-list celebrities (welcome back Chachi!)—but it was still enough to give nominee Donald Trump a big, if temporary, boost in many polls. This swing, which occurs predictably in election after election, is typically attributed to the persuasive power of the convention, with displays of party unity persuading partisans to vote for their candidate and cross-party appeals coaxing over independents and voters of the other party.
Recent research, however, suggests that swings in the polls can often be attributed not to changes in voter intention but in changing patterns of survey nonresponse: What seems like a big change in public opinion turns out to be little more than changes in the inclinations of Democrats and Republicans to respond to polls. We learned this from a study we performed during the 2012 election campaign using surveys conducted on the Microsoft Xbox. This was a highly nonrepresentative sample—much younger and more male than the voting population—but we were able to use statistical methods to create a daily voter intention poll that proved extremely accurate. The advantages of the survey were 1) people were allowed to respond multiple times, on different days, and thus we were able to track changes in individuals’ attitudes, and 2) the sample was large enough, over 15,000 per day on average, that we could get day-by-day estimates of voter intention.
Our Xbox study showed that very few respondents were changing their vote preferences—less than 2 percent during the final month of the campaign—and that most, fully two-thirds, of the apparent swings in the polls (for example, a big surge for Mitt Romney after the first debate) were explainable by swings in the percentages of Democrats and Republicans responding to the poll. This nonresponse is very loosely correlated with likeliness to vote but mainly reflects passing inclinations to participate in polling.
When there was good news for Mitt Romney, more Republicans opted to respond to the poll; when Obama was riding high, Democrats were more likely to respond. The result was that large and systematic changes in nonresponse had the effect of amplifying small changes in actual voter intention.
We can apply these insights to the 2016 convention bounces. For example, Reuters/Ipsos showed a swing from a 15-point Clinton lead on July 14 to a 2-point Trump lead on July 27. Who was responding in these polls? The pre-convention survey saw 53 percent Democrats, 38 percent Republican, and the rest independent or supporters of other parties. The post-convention respondents looked much different, at 46 percent Democrat, 43 percent Republican. The 17-point swing in the horse-race gap came with a 12-point swing in party identification. Party identification is very stable, and there is no reason to expect any real swings during that period; thus, it seems that about two-thirds of the Clinton-Trump swing in the polls comes from changes in response rates.
Looking more broadly, we examined all five polling companies that had polls posted on Huffington Post’s Pollster in July before the Republican convention and between the Republican convention and Democratic National Convention. Two of these polls showed large convention bounces, one medium, two negligible. We then looked at the change in proportion of support for Republican Donald Trump (versus Democrat Hillary Clinton) from before to after the Republican convention and compared it with the change in proportion of Republicans who took the poll (versus Democrats) from before to after the Republican convention. The correlation between reported swing in candidate preference and swing in party identification in the sample is 85 percent. That is, most of the movement is attributable to nonresponse by Democrats, rather than to any shift in support for Trump. Again, not only is party identification a very stable variable, but most of these polls ask party identification at the end of the poll, far away from voter intention, to avoid any contamination by how the respondents answer voter intention.
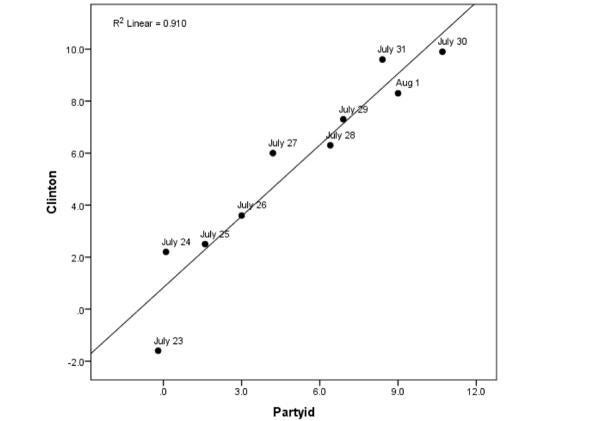
And here is another graph, prepared by political scientist Alan Abramowitz, that shows the relationship between party identification (percentage of respondents who identify as Democrats, minus percent Republicans) and vote margin (Clinton minus Trump) in the Reuters/Ipsos poll over 10 recent days of polling—July 23 to August 1. Variation in party ID explains 90 percent of the variation in Clinton vote margin.
Andrew Gelman and David Rothschild
Looking at individual polls in more detail, it appears that Trump gained among Republicans, but not among Democrats or Independents. Consider the CNN poll, which had wild swings from Clinton up 7 before the RNC to Trump up 3 after the RNC to Clinton up 9 after the DNC. We see that Clinton moved from 88 percent to 87 percent to 95 percent support from Democrats, while Trump moved from 87 percent to 89 percent to 89 percent support from Republicans. The part of Trump’s post-RNC bounce that was not driven by more Republicans answering the poll came from a small consolidation of support from Republicans. They were not supporting Clinton before; they were stating “no opinion” or “neither” as their choice. Similarly, the part of Clinton’s post-DNC bounce that was not driven by more Democrats answering the poll came from a sizable consolidation of support from Democrats. Her “no opinion” or “neither” went from 6 percent to 5 percent to 1 percent over the three polls.
It is not a surprise when self-reported partisans come around to their party’s candidate, nor are we claiming the conventions had no impact on attitudes. But in both cases the real swing was much less dramatic than would appear based on the bouncing polls.