The Ugliest Elections, Charted
Percent of attack ads by state.

“If you can’t say anything nice, don’t say anything at all.” If only politicians followed this motherly mantra! As another bitter election season concludes, the airwaves will temporarily clear of the nasty political ads that have dominated them. In the 34 states with Senate seats up for grabs, candidates and political groups ran more than 1 million TV ads to influence those races, according to a Center for Public Integrity analysis of data from Kantar Media/CMAG, an advertising tracking firm. About 46 percent of those ads were attack ads, but in some states it was far more than half:
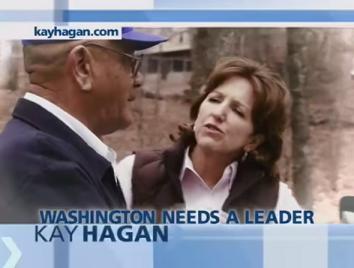
The closest races had the meanest mudslinging. In North Carolina, where the Senate candidates have been locked in a dead heat, nearly seven out of 10 ads were negative, the highest rate. The next worst fights were in Kansas, Iowa, Michigan, and Colorado, where about 60 percent of the attack ads that aired were political ads.
This story was published in collaboration with the Center for Public Integrity, a nonprofit, nonpartisan investigative news organization in Washington.