Introducing the Slate/SurveyMonkey Political Survey
Which presidential candidate would you let babysit your kids? Who’d be better at changing a tire? Who is being honest about the issues?
Slate has an announcement to make. We have teamed up with our friends at SurveyMonkey to bring you the first ever Slate/SurveyMonkey Political Survey. Each month between now and November, we will unveil an informal survey of people’s attitudes toward the presidential candidates—and how they are shifting. We want to show, in real time, how public perceptions are forming and changing around some of the big issues shaping the political conversation. This collaboration is a survey of more than 1,000 registered voters across the country, drawn from SurveyMonkey’s pool of more than 2 million survey respondents. (Conducted from May 8 to May 11, we received responses from 48 states, plus the District of Columbia. More than 60 percent of the participants were married, and the majority held full-time jobs across an array of fields. If you wanted to demographically pigeon-hole a likely survey taker, you’d probably end up with a college-educated Christian white male from California.) What it is not is a scientific poll with a rigorous margin for error. We are capturing a snapshot, not running a lab experiment.
But let’s move to the fun part.
In these early days of the campaign season, forging a personal connection with voters is critical. Both camps are trying to present their candidate as someone who connects with voters, someone who is in touch with people’s needs. Therefore, we wanted to ask survey participants who they would prefer—Obama or Romney—in basic everyday situations that demand a little bit of trust. We asked: “If your car was broken down on the side of the road, which presidential candidate would you want to stop and help you change your tire?
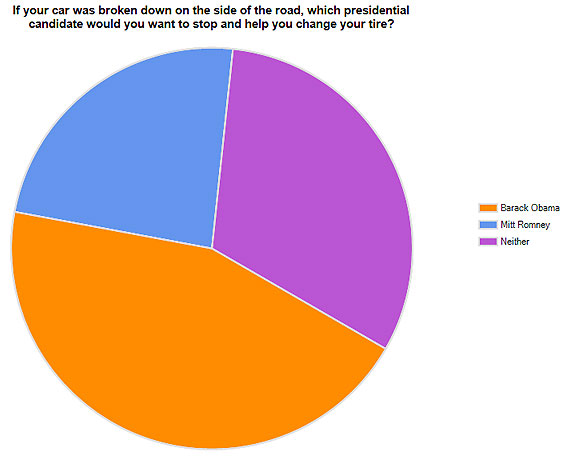
Nearly 45 percent of survey takers would welcome the sight of Obama if they got a flat tire. Only 23.9 percent would prefer to have Romney help them with a spare.
We then asked: “If you were hiring one of the presidential candidates as a baby-sitter, who would you choose?”
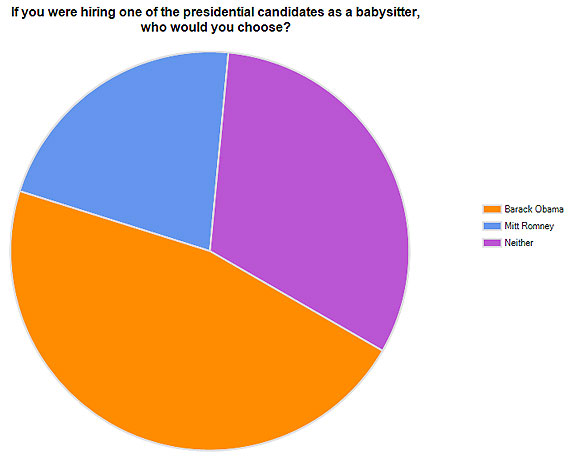
Again, trust in POTUS was high. More than 46 percent would prefer to have Obama watch their kids while they caught dinner and a movie. Only 21.8 percent of respondents would opt for the former Massachusetts governor to handle the nightly bedtime routine. (It is also worth noting that nearly one-third of respondents (31.6 percent) don’t want either candidate around their children.)
Presumably, a candidate who is successful connecting with voters is also someone people wouldn’t mind spending some time with. So, we asked: “Which presidential candidate would you rather have over to dinner?”
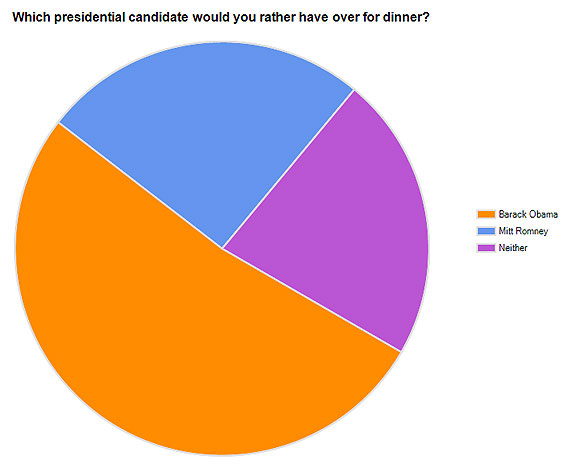
Obama posted one of his highest numbers for this question, with a solid 52 percent of the vote. Romney is not nearly as desired a dinner guest, with just under 26 percent. Then again, incumbency probably helps with a question like this. Stories about the glory days at Bain Capital have a hard time competing with being the first African-American president.
The distance between Obama and Romney shrinks when it comes to policy. While survey-takers said that they considered the president more honest than Romney on a range of issues, the gulf was not as great as the earlier set of questions.
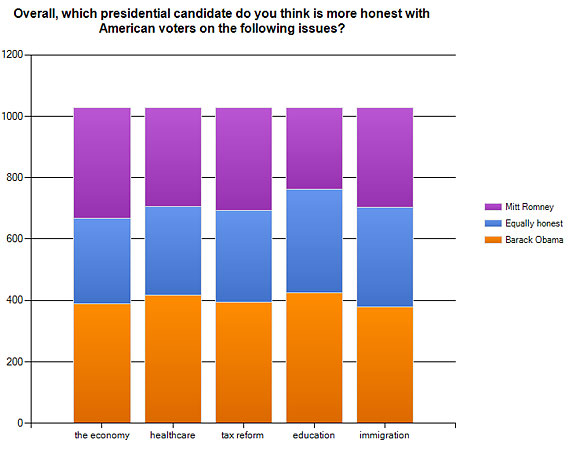
In particular, they felt the president leveled with them on education and health care. Romney’s best numbers came, not surprisingly, on the economy—a subject he has repeatedly hammered on the campaign trail. Still, if the election were held today, 45.2 percent of the respondents would vote for Obama to 38.1 percent for Romney.
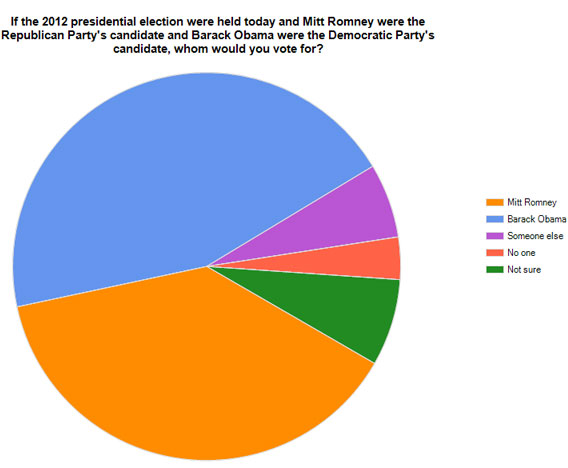
With these results in hand, it would appear that Obama is in a commanding position. He’s the kind of guy you’re thrilled to have over to the house, he seems handy enough to change a tire, and you would even let him watch your kids. Yet can he run the country? Our respondents aren’t so sure. Esteem for the president’s personal character doesn’t necessarily spill over to a high estimation of his ability to govern. In our final question, readers were asked if they approved or disapproved of the way the president was handling his job. Check out the breakdown below:
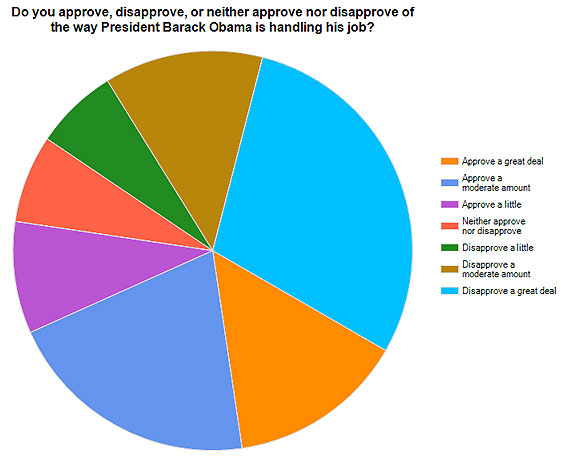
A plurality, a sizeable 29.6 percent “disapprove a great deal” with the job Obama is doing. If you add those who disapprove of his performance somewhat, the percentage of respondents who are unsatisfied with the president climbs to 48.8 percent. This despite the fact that nearly half (45.2 percent) of the survey takers claimed they would elect Obama over Romney tomorrow. If our unscientific study contains a glimmer of the general population’s mood, many Americans could be planning to vote for Obama not so much to endorse his first four years but because they prefer it to the prospect of a Romney White House. As John Dickerson observed last month, the president’s campaign would like this election to boil down to a choice between Romney and Obama. If it does, they think the president will do well. Meanwhile, Team Romney wants to cast the race as a referendum on Obama’s performance. If they succeed, then no one will care how good Romney is with a jack and a spare.