The government shutdown is making the emoticons in Washington, D.C., sadder.

This One Facebook Behavior Shows How Miserable the Shutdown Is Making Washington, D.C.

This One Facebook Behavior Shows How Miserable the Shutdown Is Making Washington, D.C.

A partnership of Slate and the New America Foundation.
Oct. 4 2013 9:13 AM

The Shutdown Is Making the Capital :(

Washington, D.C.’s emoticons reveal its new misery.

Change in the ratio of :) to :(

in Facebook interactions, from the average weekday to the day of the shutdown, Oct. 1. Hover over each bar to see the change.

Arlington, Va.
-3.42
Washington, D.C.
-2.19
Provo, Utah
-1.74
Alexandria, Va.
-1.6
San Diego, Calif.
-1.53
Charlottesville, Va.
-1.45
Pensacola, Fla.
-1.43
Charleston, W.Va.
-1.35
Redding, Calif.
-1.34
Wichita, Kan.
-1.32
Scranton, Pa.
-1.28
Columbia, S.C.
-1.28
Murfreesboro, Tenn.
-1.22
Clarksville, Tenn.
-1.2
Honolulu, Hawaii
-1.14
Ogden, Utah
-1.13
Virginia Beach, Va.
-1.11
Germantown, Md.
-1.1
Winston-Salem, N.C.
-1.08
Colorado Springs, Colo.
-1.07
Huntsville, Ala.
-1.05
Norfolk, Va.
-1.02
New Orleans, La.
-1.01
Scottsdale, Ariz.
-1
Dayton, Ohio
-1
La Crosse, Wis.
-1
Overland Park, Kan.
-0.98
Knoxville, Tenn.
-0.97
Fort Wayne, Ind.
-0.94
Ann Arbor, Mich.
-0.94
Roanoke, Va.
-0.9
Vancouver, Wash.
-0.87
Davenport, Iowa
-0.86
Lansing, Mich.
-0.86
Saint Paul, Minn.
-0.85
Durham, N.C.
-0.83
Little Rock, Ark.
-0.82
Chandler, Ariz.
-0.81
Lincoln, Neb.
-0.78
Appleton, Wis.
-0.77
Charleston, S.C.
-0.75
Portland, Ore.
-0.74
Bellevue, Wash.
-0.71
Omaha, Neb.
-0.69
Winchester, Nev.
-0.68
Newark, N.J.
-0.68
Columbia, Mo.
-0.66
Mesa, Ariz.
-0.64
Evansville, Ind.
-0.63
Killeen, Texas
-0.63
Augusta, Ga.
-0.62
Jacksonville, Fla.
-0.62
Allentown, Pa.
-0.62
Sioux Falls, S.D.
-0.61
Kalamazoo, Mich.
-0.61
Salem, Ore.
-0.59
College Station, Texas
-0.57
Olympia, Wash.
-0.56
Missoula, Mont.
-0.56
Plano, Texas
-0.56
Raleigh, N.C.
-0.56
Baton Rouge, La.
-0.55
Tallahassee, Fla.
-0.54
San Francisco, Calif.
-0.54
New York, N.Y.
-0.53
Lexington, Ky.
-0.53
Jersey City, N.J.
-0.52
Kansas City, Mo.
-0.52
Irvine, Calif.
-0.52
Detroit, Mich.
-0.52
Rochester, Minn.
-0.51
Las Vegas, Nev.
-0.49
Amarillo, Texas
-0.49
Syracuse, N.Y.
-0.49
Fresno, Calif.
-0.48
Springfield, Mo.
-0.47
Sacramento, Calif.
-0.44
Oklahoma City, Okla.
-0.44
Long Beach, Calif.
-0.44
Chula Vista, Calif.
-0.44
Beaumont, Texas
-0.44
Brownsville, Texas
-0.43
Bloomington, Ind.
-0.43
Albany, N.Y.
-0.42
Charlotte, N.C.
-0.41
Rockford, Ill.
-0.41
Modesto, Calif.
-0.41
Rochester, N.Y.
-0.4
Madison, Wis.
-0.4
Saint Louis, Mo.
-0.38
Austin, Texas
-0.38
Spring Valley, Nev.
-0.37
Richardson, Texas
-0.37
Gainesville, Fla.
-0.37
Nashville, Tenn.
-0.36
Indianapolis, Ind.
-0.35
Aurora, Colo.
-0.35
Montgomery, Ala.
-0.35
Lakeland, Fla.
-0.35
Fayetteville, N.C.
-0.35
Eugene, Ore.
-0.34
Mount Laurel, N.J.
-0.34
Arlington, Texas
-0.34
Livingston, N.J.
-0.34
Cincinnati, Ohio
-0.33
Richmond, Va.
-0.32
Minneapolis, Minn.
-0.32
Stockton, Calif.
-0.32
Memphis, Tenn.
-0.32
Saint Petersburg, Fla.
-0.31
Reno, Nev.
-0.3
North Las Vegas, Nev.
-0.3
Wakefield, Mass.
-0.29
Spokane, Wash.
-0.29
Moreno Valley, Calif.
-0.28
Phoenix, Ariz.
-0.27
South Bend, Ind.
-0.27
San Antonio, Texas
-0.26
Springfield, Ill.
-0.26
Columbus, Ohio
-0.26
Los Angeles, Calif.
-0.25
Bronx, N.Y.
-0.24
Albuquerque, N.M.
-0.24
Cleveland, Ohio
-0.24
Tucson, Ariz.
-0.23
Boston, Mass.
-0.23
Buffalo, N.Y.
-0.22
Cape Coral, Fla.
-0.21
Denver, Colo.
-0.21
San Jose, Calif.
-0.21
Anchorage, Alaska
-0.2
Birmingham, Ala.
-0.2
Newport News, Va.
-0.2
Providence, R.I.
-0.2
Seattle, Wash.
-0.19
Cedar Rapids, Iowa
-0.17
Miami, Fla.
-0.17
Tempe, Ariz.
-0.17
Louisville, Ky.
-0.17
Baltimore, Md.
-0.17
Everett, Wash.
-0.17
Fort Worth, Texas
-0.15
Toledo, Ohio
-0.15
Mobile, Ala.
-0.15
Herndon, Va.
-0.15
Atlanta, Ga.
-0.13
Marina del Rey, Calif.
-0.13
Greensboro, N.C.
-0.12
San Bernardino, Calif.
-0.11
Lubbock, Texas
-0.11
Orlando, Fla.
-0.09
Dallas, Texas
-0.08
Erie, Pa.
-0.08
Manchester, N.H.
-0.06
Salt Lake City, Utah
-0.06
Tacoma, Wash.
-0.06
Bakersfield, Calif.
-0.05
Tampa, Fla.
-0.05
Pittsburgh, Pa.
-0.04
Ashburn, Va.
-0.02
Corpus Christi, Texas
-0.02
Chicago, Ill.
-0.02
Philadelphia, Pa.
-0.01
Fontana, Calif.
+0
El Paso, Texas
+0.01
Victorville, Calif.
+0.01
Ocala, Fla.
+0.02
Houston, Texas
+0.02
Burbank, Calif.
+0.02
Akron, Ohio
+0.02
Boise, Idaho
+0.02
Conyers, Ga.
+0.03
Grand Rapids, Mich.
+0.04
Topeka, Kan.
+0.04
Savannah, Ga.
+0.05
Fort Lauderdale, Fla.
+0.05
Chattanooga, Tenn.
+0.05
Lancaster, Pa.
+0.06
Lancaster, Calif.
+0.06
Brooklyn, N.Y.
+0.09
Fort Myers, Fla.
+0.12
Riverside, Calif.
+0.12
Milwaukee, Wis.
+0.15
Jackson, Miss.
+0.18
Bangor, Maine
+0.2
West Palm Beach, Fla.
+0.23
Chico, Calif.
+0.23
Des Moines, Iowa
+0.24
Irving, Texas
+0.25
Muskegon, Mich.
+0.26
Santa Ana, Calif.
+0.29
Odessa, Texas
+0.3
McAllen, Texas
+0.37
Fremont, Calif.
+0.39
Billings, Mont.
+0.43
Anaheim, Calif.
+0.46
Oakland, Calif.
+0.47
Denton, Texas
+0.54
Laredo, Texas
+0.54
Fort Collins, Colo.
+0.55
Green Bay, Wis.
+0.59
Flint, Mich.
+0.65
Greenville, S.C.
+0.66
Tulsa, Okla.
+0.72
Worcester, Mass.
+0.83
Garden Grove, Calif.
+0.83
Beverly Hills, Calif.
+0.85

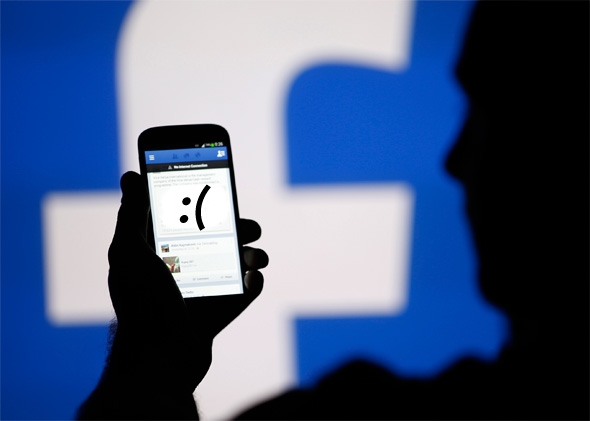
The government shutdown is making Washington, D.C., and nearby Arlington sad, or, at least, more likely to use :( over :) on Facebook.

For about 200 major and medium-sized cities, Slate determined how many Facebook interactions used :) and how many used :(, then computed a ratio between the two. The higher this “Smiley Score” for a city, the more :) emoticons appeared in its Facebook interactions relative to :(.

For example, a week before the shutdown, Washington, D.C., had a Smiley Score of about 8.4. That means :) appeared in about eight times more Facebook interactions than :(. If that seems high, :) is used much more than :( everywhere. The average score for a city that day was 6.5.

Advertisement

On the first day of the shutdown, the Smiley Score plummeted in Washington, D.C., and Arlington, where thousands of federal workers live and work. Although most cities saw a decline, which may have to do more with normal variance in the national mood than anything else, D.C. and Arlington experienced the biggest drops by far.

The score for the average weekday in the week before the shutdown was 7.5 in D.C. On the first day of the government shutdown, the city’s score dropped to 5.3. Only one city saw a steeper decline: Arlington, which plummeted from 9.2 to 5.8.

Also appearing in the top 20 with the greatest score drops are cities with large percentages of federal workers, such as Virginia Beach, Va.; Ogden, Utah; Colorado Springs, Colo.; Alexandria, Va.; and San Diego, Calif.

Just a coincidence? Possibly. It’s anyone’s guess whether Americans’ emoticons can really be taken as a measure of their happiness, and absent from this analysis are the especially emotive :’( and :D. Even so, the results make sense. About 800,000 federal workers can’t go to work and aren’t getting their paychecks, hundreds of thousands of “essential” others are expected to go to work without getting paid, and so far Congress isn’t doing much to turn those (s into )s.

Methodology: Using Facebook’s Keyword Insights API, Slate collected mention count data for :) and :( for six 24-hour time periods: each weekday of the week of Sep. 23 and the first day of the government shutdown, Oct. 1. Slate grouped the data by city, limiting the analysis to cities with 50,000 or more counts of both emoticons over all six days. For each city and day, the ratio between counts of :) and :( was calculated. The chart illustrates the change between that ratio on the average weekday in the week of Sep. 23 and the same ratio on Oct. 1. The Keyword Insights API, which is only currently available to certain developers, estimates mention counts from a sample of one-fifth of all Facebook interactions, which include comments and status updates but not private messages.
Chris Kirk is a web developer at New York magazine and Slate’s former interactives editor. Follow him on Twitter.