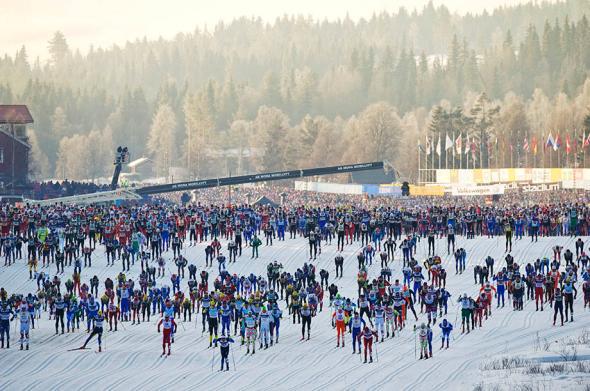
For cross-country skiers, the first week of March is like the Kentucky Derby, Wimbledon, the World Series, the World Cup, and Super Bowl all rolled into one. That’s Vasaloppet Week, a series of races held in the vicinity of Mora, in the Dalarna region of Sweden, culminating in the Vasaloppet race itself, running 90 kilometers over hill and dale between Sälen and Mora. The Vasaloppet is named in honor of Gustav Vasa, the eventual King of Sweden who led the resistance against Christian II when Sweden rose to shake off the yoke of the Kalmar Union in 1521. Gustav Vasa passed through Mora to try to raise troops to join his movement, but when the locals declined, he skied to Sälen on the way to refuge over the Norwegian border. But in a dramatic turnaround, the villagers had a change of heart, raced after him, and overtook him, eventually joining the would-be king in victory.
The race has been held annually (with only a few exceptions) since 1922, when 136 skiers signed up for the race. The race has now been capped at 15,800 participants, and bibs sell out within about three minutes of going up for sale online. The motto of the race, shown on the portal to the finish line, is “I fäders spår—för framtids segrar” (“In fathers’ tracks for the victories of the future”).
Umm, about that “future”—sad to say, the Vasaloppet has been on life support for nearly a decade now. The cancellation of the race in 1990 because of extreme lack of snow was a wakeup call. In all of its history, the race had been canceled only once before on account of weather conditions (in 1932; in 1934 the race was canceled because too few participants signed up). In the years following 1990, a “snow security” plan was put into effect to allow for enough production of artificial snow to assure the course would be skiable during Vasaloppet Week. By 2007 there was enough artificial snow capacity in place to produce cover for 100 kilometers of tracks, if none of that melted after being laid down.
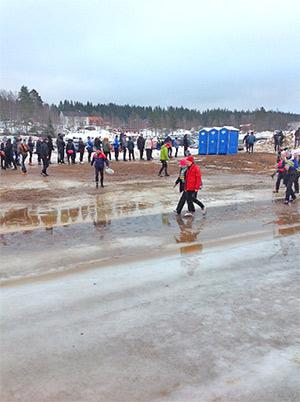
Photo courtesy Scott Travis
I suppose this is a good example of technological “adaptation” to climate change, but even this fix has its limits, as the snow can be made only on days when the temperature drops below minus 5 degrees Celsius and it turns to muddy slush if the ground isn’t sufficiently frozen. Last year the race was nearly canceled because key parts of the track were too boggy to allow passage of the equipment used to deliver snow and maintain the track. The race was rescued only at the last minute through delivery of snow by helicopter. (Let’s not think about the carbon dioxide emissions due to that operation.) This year conditions were better because of harder frozen ground, but yet again the race was rescued only by artificial snow.
I was not one of those 15,800 lucky ones to get a bib and doubt if I could have finished the race if I did, but I did ski a considerable portion of the track back in February. It was a vacation—a quaint idea that still exists in Europe—and I was prompted to think of what the future holds for the course just as the temperature crept past the upper range of my “universal” silver klister ski wax and I started sliding backward down the hills. By the time I was heading home, things were pushing the 12-degree C top range of the KR70 Aqua klister ski wax. (Any warmer than that and you’re not skiing, your waterskiing.)
When looking at a small region such as Dalarna, the year-to-year variability can make it hard to discern a clear trend, and it’s easy to fool yourself with anecdotal evidence. There has been a string of warm years recently, but none has yet surpassed the record-warm Vasaloppets that occurred in 1930 (11.1 C), 1938 (8 C), 1950 (9 C), 1959 (12 C) and 1971 (8 C). Last Sunday’s race came in at an 8.5 C peak temperature in Mora, which manages to bump out only 1938 and 1971. But still, the efforts needed to keep the race going in recent years suggested something strange is going on. So, as soon as I got home, I hit the Swedish Weather Service, or SMHI, data archives to see what I could come up with.
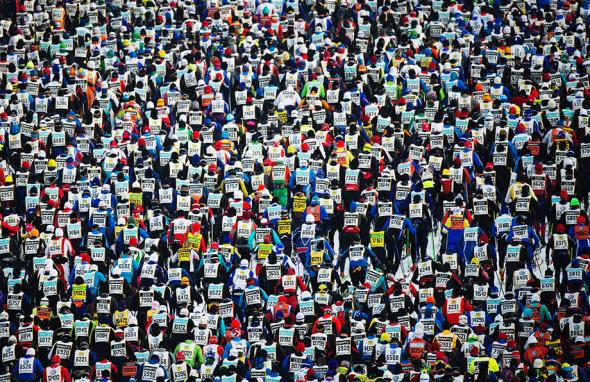
Photo by Jonathan Nackstrand/AFP/Getty Images
There is a weather observation station in Mora, but it was moved to the airport in 1995, so, to avoid any possibility of artifacts due to the move, I chose nearby Malung instead, which has a continuous record since 1951. The peak temperature years at Malung don’t line up exactly with those in Mora, and Malung tends to be a bit cooler because it’s 150 meters higher, but for the purposes of spotting major changes over time, Malung should do fine. Since the freely available validated data goes back to only 1951, we won’t be able to look at what’s going on in the warm years of the 1930s, but I’ll get my hands on that data eventually. Meanwhile, let’s take a look at what we’ve got.
To get a better feel for the occurrence of warm weather around Vasaloppet Week, I cast the net a bit wider and looked at maximum temperature from Feb. 25 to March 8, rather than just the day of the Vasaloppet itself. This graph shows the resulting maximum temperature for each year, with the blue dots being below the average and the red dots above the average for the period from 1951 to the present.
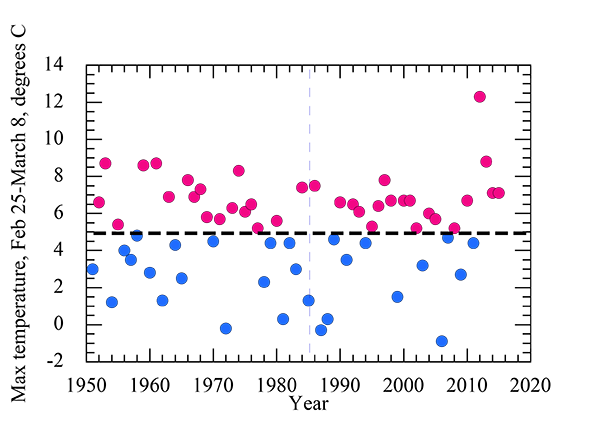
Raymond T. Pierrehumbert
From this graph we learn a couple of things. First, it’s nothing new for Vasaloppet skiers to be skiing on klister in above-freezing conditions, particularly in the warmer conditions toward the end of the race as skiers approach Mora (both later in the day and lower in altitude). The average maximum temperature over the whole period is about 5 C. For 1985 and earlier, there are 18 dots above the mean and 17 below, which is more or less what you’d expect by chance (but of course we should reserve judgment until we push the analysis back to the 1930s). After 1985 there are 19 dots above average but only 11 below average, so there does seem to have been some shift to warmer conditions, particularly in recent years.
But the peak temperature doesn’t tell the whole story of why the race is in trouble. For example, the temperature in 1990, when the race was canceled, was above normal but not especially so. Partly this is because warm conditions create more problems in years that are also short of snowfall in the months before the race, but what really creates big problems is a lot of melting conditions and warm nights in February. Snow melts whenever the air temperature is above freezing, and the amount of melt can be characterized by “degree days above freezing.” The difference with the melt statistic is that we count only days (or portions of days) that are above freezing; each day or portion of a day above freezing is multiplied by the amount above freezing (which is just the temperature in Celsius), and summed up. This statistic for each February is shown in the following graph.

Raymond T. Pierrehumbert
Looked at this way, we see that 1990 now stands out as a year with extreme melting conditions before the race. In fact, above-average melting conditions were rare before 1989, but nearly every February since has had above-average melting conditions, often by a wide margin. No wonder the race is in trouble.
So far, the melting snow has not slowed down the winning skiers much. This year’s winner in the men’s division, Norway’s Petter Eliassen, came in at four hours, one minute, and 48 seconds, with the women’s division winner, Poland’s Justyna Kowalczyk, coming in not far behind at four hours, 41 minutes, and two seconds. Neither one is a new record, but these times are only about half an hour longer than those of winners in colder years. And they are still way faster than times clocked in Grandfather’s day. Artur Häggblad, the winner in 1940, took more than six hours to complete the course. Wet snow is actually pretty fast, as long as it’s not too soft. (Even though the Vasaloppet is a classic-stride race, strong skiers these days wax their skis as slick as possible and double-pole their way to victory, except for the steepest uphill bits.) But how long can this go on?
It is always hazardous to draw conclusions from a limited region and short time period, but two decades is beginning to be long enough to suspect that something unusual is going on, even in a region as small as Dalarna. What do the models say? SMHI provides an excellent website where you can explore the implications of global warming forecasts for any region of Sweden, and for any season. This map shows the expected warming under the high-end RCP8.5 scenario (which, sadly, we are tracking rather well) toward the end of the century.
You can see the characteristic amplification of warming as you go farther north, but even around Mora the mean spring temperature is expected to be about 5 C warmer than it was in the 1970s. Let’s look at a graph of the expected spring warming in Dalarna by year so we can get a better idea of the timing of the warming.
As is typical for forecasts of this sort, the “forecast” actually starts some time in the past, so that you can check how well the actual observations agree with the model. (The observations themselves from those years are not used in carrying out the simulation and thus can serve to compare the model’s predictions with reality.) The vertical bars give the observed temperatures, and we see again that above-normal temperatures have prevailed since 1990. The black line shows that the expected warming in this region should start about 1995, whereas reality jumped the gun a bit, but on the whole, the amount of warming tracks the expected 1-to-1.5 C mean warming rather well.
Now what about the future? The black-line “forecast” is really the average of many runs of the various models, and represents something like the average climate you’d get if you could “rerun” the real Earth many different times and average the results. Since in fact we live in only one “realization” of the climate, the real climate will deviate up or down around this line, but if the black line is taken as a best guess for what to expect, in this region the situation is expected to get only slightly worse (for the Vasaloppet) out to 2050. So until then, we can expect more of the same—lots of threatened years, lots of slush, but the race will probably go on, given enough artificial snow and helicopter drops. But after that, things get progressively worse, unless we manage to get off the current nightmare scenario of high emissions of greenhouse gases. After the warming “pause” (yes, climate models are completely capable of yielding temporary pauses in warming), the climate makes up for lost time and warms up by an additional 4 C by the end of the century.
At that point, unless people are skiing on polystyrene beads, the race may be “in fathers’ track,” but it will most likely be run in mud boots. The “future victory” lauded in the Vasaloppet motto will go to Mother Nature, who always gets the last word.